What “Observability” Means for a GraphQL API
Observability is the ability to understand what your GraphQL server is doing in production by looking at its outputs: logs, traces, and metrics. For GraphQL, observability must answer questions that are harder than in REST because a single request can execute many resolvers, touch multiple backends, and return partial data with errors. Good GraphQL observability lets you: identify which operations are slow or expensive, see which fields and resolvers contribute to latency, correlate a client request to downstream calls, detect error hotspots by operation and field, and understand traffic patterns (operation names, clients, and variables shapes) without leaking sensitive data.
In practice, you will instrument at three levels: request-level (the whole GraphQL operation), execution-level (per field or per resolver), and dependency-level (database, cache, HTTP calls). You will also standardize identifiers so logs, traces, and metrics can be joined: a request ID, a trace ID, an operation name, and a stable operation hash.
Key Signals to Capture in GraphQL
Before choosing tools, decide what you need to measure. At minimum, capture: operation identity (operationName and a persisted query ID or document hash), client identity (app name/version, platform), request size (query length, variables size), response size, execution time, resolver timings, error count and error locations (path), and dependency timings (SQL, cache, HTTP). Also capture whether the response was partial (data plus errors) and whether the request was served from cache or required full execution.
GraphQL adds a few signal types that are uniquely valuable: field usage (which fields are requested most), resolver fan-out (how many child resolvers executed), and “shape” indicators (depth, number of selected fields). Even if you already enforce limits elsewhere, recording these values helps explain sudden latency changes and capacity needs.
Structured Logging: Designing Logs You Can Query
Structured logging means emitting logs as machine-readable key-value data (typically JSON) rather than free-form strings. For GraphQL, structured logs should be designed so you can filter by operation, correlate to a trace, and drill down to resolver or dependency events. A good rule: every log line should include enough context to be useful on its own, but not so much that you leak secrets or explode storage costs.
- Listen to the audio with the screen off.
- Earn a certificate upon completion.
- Over 5000 courses for you to explore!

Download the app
What to Log at Request Start and End
Emit a “request started” log when the HTTP request enters the server and a “request completed” log when the response is sent. Include: timestamp, log level, requestId, traceId (if tracing is enabled), HTTP method and route, status code, durationMs, operationName, operationHash (or persisted query ID), clientName/clientVersion, and a summary of execution (fieldCount, depth, resolverCount, errorCount). Do not log full variables by default; instead, log a variables schema (keys only) or a redacted subset.
{"level":"info","msg":"graphql.request.start","requestId":"r-7c1","traceId":"4bf92f...","method":"POST","path":"/graphql","operationName":"GetProduct","operationHash":"sha256:ab12...","clientName":"web-store","clientVersion":"1.42.0","queryLength":842,"variablesKeys":["id","locale"]}{"level":"info","msg":"graphql.request.end","requestId":"r-7c1","traceId":"4bf92f...","status":200,"durationMs":128,"operationName":"GetProduct","operationHash":"sha256:ab12...","depth":6,"fieldCount":54,"resolverCount":38,"errorCount":0,"responseSizeBytes":18342}Logging Errors with GraphQL-Specific Context
When an error occurs, include the GraphQL error path and locations (line/column) if available, plus a stable error code. The path is critical because it tells you which field failed even when the HTTP status is 200. Also log whether the error was “handled” (expected) or “unhandled” (bug). Avoid logging raw stack traces at info level; keep them at error level and ensure they are not returned to clients.
{"level":"warn","msg":"graphql.execution.error","requestId":"r-7c1","traceId":"4bf92f...","operationName":"GetProduct","operationHash":"sha256:ab12...","errorCode":"UPSTREAM_TIMEOUT","path":["product","reviews"],"locations":[{"line":12,"column":5}],"durationMs":120,"handled":true}Step-by-Step: Add a Logging Middleware Around GraphQL
Step 1: Create a request context that contains requestId, traceId, client metadata, and operation identity. Step 2: At request start, log a structured event with query length and variable keys. Step 3: After parsing/validation, attach operationName and operationHash to the context. Step 4: On completion, log duration, status, and execution summary. Step 5: On errors, log a separate event per error with path and code. Step 6: Add redaction rules for headers and variables (for example: Authorization, cookies, tokens, email, phone, address).
The following pseudo-code shows the idea in a Node.js-style server, but the pattern applies to any runtime:
// Pseudo-code: request wrapper around GraphQL execution
async function handleGraphQL(req, res) {
  const requestId = req.headers['x-request-id'] ?? generateId();
  const clientName = req.headers['apollographql-client-name'];
  const clientVersion = req.headers['apollographql-client-version'];
  const start = Date.now();

  const ctx = { requestId, clientName, clientVersion };
  log.info({ msg: 'graphql.request.start', requestId, clientName, clientVersion, queryLength: req.body.query?.length, variablesKeys: Object.keys(req.body.variables ?? {}) });

  try {
    const result = await executeGraphQL({ query: req.body.query, variables: redact(req.body.variables), context: ctx });
    const durationMs = Date.now() - start;
    log.info({ msg: 'graphql.request.end', requestId, durationMs, status: 200, operationName: ctx.operationName, operationHash: ctx.operationHash, errorCount: result.errors?.length ?? 0 });
    res.status(200).json(result);
  } catch (err) {
    const durationMs = Date.now() - start;
    log.error({ msg: 'graphql.request.crash', requestId, durationMs, err: serializeError(err) });
    res.status(500).json({ errors: [{ message: 'Internal error' }] });
  }
}
Distributed Tracing: Seeing Resolver Work Across Services
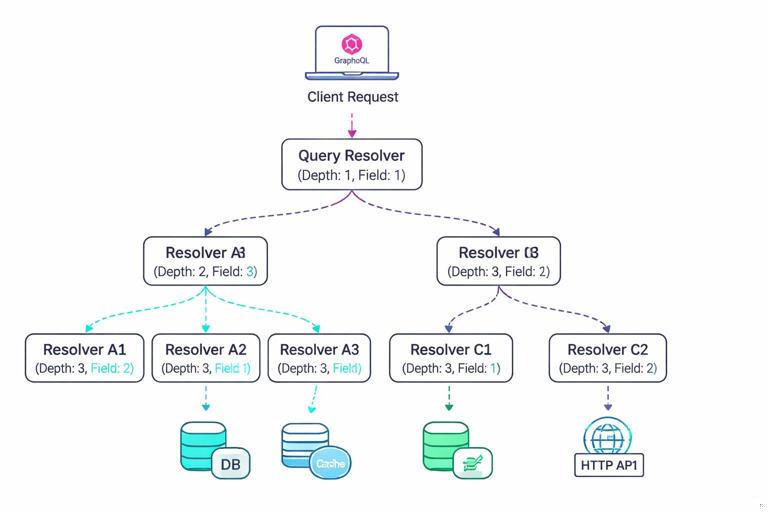
Tracing records a timeline of spans that represent work. In GraphQL, a single incoming request span should contain child spans for parsing/validation, execution, and then resolver spans (optionally) and dependency spans (database queries, HTTP calls). Distributed tracing becomes essential when resolvers call other services, because it lets you see where time is spent and which downstream dependency caused the slowdown.
Trace Structure for a GraphQL Request
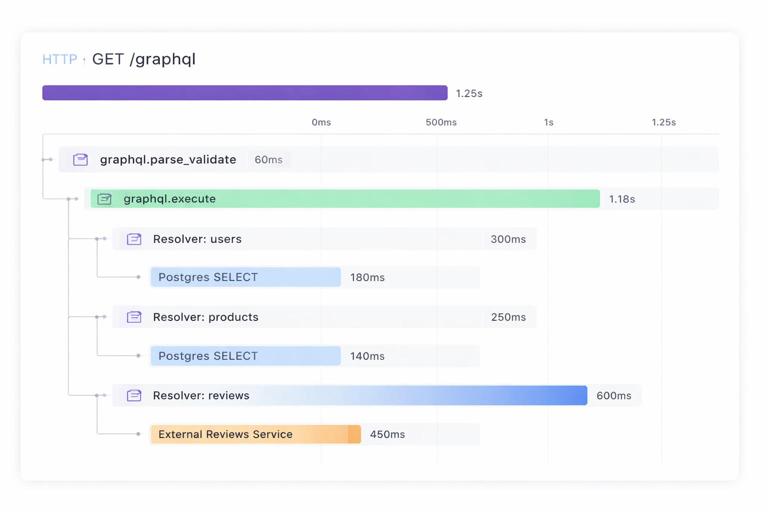
A practical trace structure is: an HTTP server span as the root, a “graphql.execute” span, and then spans for each major dependency. Per-field spans can be very expensive in high-traffic systems, so many teams start with per-resolver spans only for slow operations or sample them. Another approach is to create spans only for resolvers that cross process boundaries (HTTP/gRPC) or perform I/O, and skip pure in-memory resolvers.
- Span: http POST /graphql (attributes: requestId, clientName, operationName, operationHash)
- Span: graphql.parse_validate (attributes: queryLength)
- Span: graphql.execute (attributes: depth, fieldCount)
- Span: resolver Product.reviews (attributes: path, parentType, fieldName)
- Span: http GET reviews-service /reviews?productId=… (attributes: status, retries)
- Span: db SELECT … (attributes: db.system, db.statement fingerprint)
Step-by-Step: Instrument Tracing with OpenTelemetry Concepts
Step 1: Enable an OpenTelemetry SDK in your server runtime and configure an exporter (for example, OTLP to your tracing backend). Step 2: Ensure incoming HTTP requests extract trace context headers so traces continue from upstream. Step 3: Create a root span for the HTTP request and attach requestId and client metadata as attributes. Step 4: Create a child span for GraphQL execution and set operationName and operationHash once known. Step 5: Instrument outbound HTTP clients and database clients so dependency spans are created automatically. Step 6: Decide on resolver-level spans: either always on for a subset of operations, or sampled, or only for resolvers above a latency threshold. Step 7: Propagate trace context to downstream services so their spans join the same trace.
When adding attributes, prefer stable, low-cardinality values. For example, operationName is low-cardinality; raw query text is high-cardinality and should not be attached to spans in production. If you need query text for debugging, store it in a secure, sampled debug log with strict access controls.
Correlating Traces with Logs
To move quickly from an alert to root cause, logs and traces must share identifiers. Include traceId and spanId in every log line emitted during request handling. Many logging libraries can automatically inject these values from the active span context. With this, you can click from a slow trace to the exact error logs for the same request, or search logs for a requestId and then open the trace.
Metrics: Measuring Health, Performance, and Usage
Metrics are numeric time series used for dashboards and alerting. For GraphQL, you want a blend of “golden signals” (latency, traffic, errors, saturation) and GraphQL-specific breakdowns by operation and sometimes by field. The main challenge is label cardinality: if you label metrics by raw query text or user ID, you will create too many time series and overload your monitoring system. Use operationName and operationHash (or persisted query ID) as primary dimensions, and keep clientName as optional if it is bounded.
Core Metrics to Emit
- Request rate: graphql_requests_total (labels: operationName, operationHash, statusClass)
- Latency: graphql_request_duration_seconds histogram (labels: operationName, operationHash)
- Error rate: graphql_errors_total (labels: operationName, operationHash, errorCode)
- Partial responses: graphql_partial_responses_total (labels: operationName, operationHash)
- Response size: graphql_response_size_bytes histogram (labels: operationName, operationHash)
- Dependency latency: db_duration_seconds, http_client_duration_seconds (labels depend on your instrumentation, keep them bounded)
GraphQL-specific metrics that are often worth adding: selected field count histogram, query depth histogram, resolver execution time histogram for a curated set of resolvers, and cache hit rate if you have caching at any layer. If you already compute a “complexity score” elsewhere, emitting it as a histogram can help correlate performance with query shapes.
Step-by-Step: Add Operation-Level Metrics Safely
Step 1: Normalize operation identity. Require clients to send operationName and compute an operationHash from the document (or use persisted query IDs). Step 2: Create a timer at request start and observe duration on completion. Step 3: Increment a request counter with labels operationName and operationHash. Step 4: If errors exist, increment an error counter per errorCode (keep codes bounded). Step 5: Record response size and basic shape metrics (depth, fieldCount) as histograms without adding too many labels. Step 6: Create dashboards that show top operations by p95 latency, top operations by error rate, and traffic by clientName.
// Pseudo-code: metrics recording
metrics.requestsTotal.inc({ operationName, operationHash, statusClass: '2xx' });
metrics.requestDuration.observe({ operationName, operationHash }, durationSeconds);
metrics.responseSize.observe({ operationName, operationHash }, responseSizeBytes);
if (errors.length) {
  metrics.partialResponsesTotal.inc({ operationName, operationHash });
  for (const e of errors) metrics.errorsTotal.inc({ operationName, operationHash, errorCode: e.code ?? 'UNKNOWN' });
}
metrics.queryDepth.observe({}, depth);
metrics.fieldCount.observe({}, fieldCount);
Field- and Resolver-Level Observability Without High Overhead
Resolver-level visibility is where GraphQL observability becomes most actionable, but it can be expensive if you instrument every field for every request. A practical approach is to combine: sampling (only trace a percentage of requests), thresholds (only create resolver spans when a resolver exceeds N milliseconds), and allowlists (only instrument resolvers that are known hotspots or that call external dependencies).
For metrics, avoid labeling by resolver path for every field because it can create too many time series. Instead, choose a small set of “key resolvers” and emit metrics for them, or aggregate resolver timings into a single per-request summary log that includes the top N slowest resolvers. That summary can be emitted only when the request duration exceeds a threshold, which keeps volume manageable while preserving debugging value.
Step-by-Step: Emit a “Slow Resolver Summary” Log
Step 1: In your resolver wrapper, measure duration for each resolver and store it in an in-memory list on the request context. Step 2: At request end, if total duration exceeds a threshold (for example p95 target), sort resolver timings and keep the top N. Step 3: Log a single structured event containing operation identity and the slowest resolvers with their paths and durations. Step 4: Use this log to guide optimization work and to decide which resolvers deserve dedicated metrics or tracing spans.
{"level":"info","msg":"graphql.slow_resolvers","requestId":"r-7c1","operationName":"GetProduct","operationHash":"sha256:ab12...","durationMs":980,"topResolvers":[{"path":"product.reviews","ms":420},{"path":"product.recommendations","ms":210},{"path":"product.price","ms":95}]}Handling Sensitive Data: Redaction and Safe Attributes
Observability can accidentally become a data leak if you log variables, headers, or response payloads. Define a redaction policy: never log Authorization headers, cookies, tokens, or raw personal data. For variables, prefer logging only keys and types, or a hashed representation for debugging uniqueness without revealing content. For tracing attributes, avoid raw IDs that are user-identifying unless you have a clear policy and access controls; if you need user correlation, use an internal, non-PII user key and keep it low-cardinality.
Also consider multi-tenant systems: include tenantId as an attribute only if it is bounded and not sensitive, and ensure it is used for filtering and alert routing. If tenantId is high-cardinality, keep it in logs (searchable) but not in metrics labels.
Dashboards and Alerts That Match GraphQL Reality
Dashboards should answer operational questions quickly: Which operations are slow right now? Is latency isolated to one client or across all clients? Are errors concentrated in a specific field path? Are downstream dependencies causing the issue? Build dashboards around operationName and operationHash, and include panels for p50/p95/p99 latency, request rate, error rate, partial response rate, and response size. Add a “top N operations by p95 latency” table and a “top N operations by error rate” table.
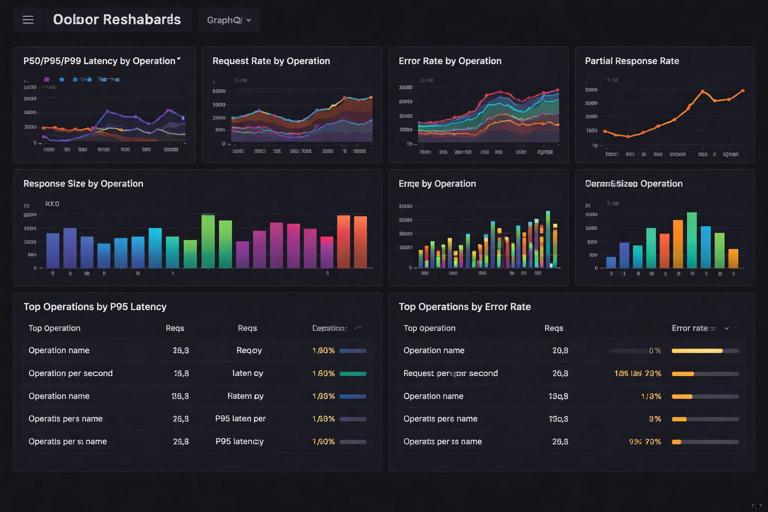
For alerting, prefer symptom-based alerts: high p95 latency for a critical operation, sustained error rate above a threshold, or a spike in partial responses. Pair these with dependency alerts (database latency, upstream timeouts) so you can quickly see whether the GraphQL layer is the cause or the messenger. When an alert fires, the runbook should tell you exactly which logs to query (by operationHash) and which traces to inspect (by traceId from the slow request logs).
Operational Workflow: From Incident to Root Cause
A repeatable workflow reduces time-to-recovery. Start from an alert (for example, p95 latency for operation “Checkout” increased). Use metrics to confirm scope (which operationHash, which clientName). Then pivot to traces for representative slow requests to see which spans dominate time (database, upstream HTTP, or a specific resolver). Finally, use structured logs to find error details and slow resolver summaries for the same traceId. This triad—metrics for detection, traces for causality, logs for detail—works especially well for GraphQL because the HTTP status alone is not enough to understand failures.