Why interpretation is where experiments succeed or fail
After you have an estimate and uncertainty, the hardest part is often not the math but the interpretation: deciding what the result means for the business, what it does not mean, and how to communicate it without accidentally (or intentionally) “finding significance.” This chapter focuses on two skills that protect decision quality: (1) avoiding p-hacking and other forms of selective reporting, and (2) translating results into a clear stakeholder narrative that supports an action.
Interpretation is not only about whether an effect exists; it is about whether the effect is large enough, reliable enough, and relevant enough to justify a decision under constraints (risk, cost, brand, fairness, operational capacity). A statistically significant change can be operationally irrelevant; a non-significant result can still be decision-relevant if the uncertainty is small enough to rule out meaningful upside; and a “mixed” result can be a strong signal if it aligns with mechanisms and guardrails.

What p-hacking looks like in business experimentation
“P-hacking” is a catch-all term for analyzing data in many ways and selectively reporting the version that produces a desirable p-value or headline. In business contexts, it often happens unintentionally because teams are under time pressure, metrics are plentiful, and stakeholders want a simple yes/no answer. The core problem is not curiosity; it is changing the analysis plan after seeing the data and then treating the resulting p-values as if they came from a single pre-specified test.
Common p-hacking patterns (and why they are tempting)
Peeking and stopping early: checking results daily and ending the test when the p-value dips below 0.05. This inflates false positives because you effectively run many tests over time.
Metric shopping: trying multiple outcomes (conversion, revenue, clicks, time on site) and highlighting whichever “wins.” If you test enough metrics, something will look significant by chance.
Continue in our app.- Listen to the audio with the screen off.
- Earn a certificate upon completion.
- Over 5000 courses for you to explore!

Download the app
Segment shopping: slicing by country, device, channel, new vs returning, and reporting only the best segment. This can be legitimate exploration, but it is not confirmatory evidence unless planned and corrected.
Flexible data cleaning: changing outlier rules, excluding “bots,” or redefining active users until results look better. Cleaning rules must be justified independently of the observed treatment effect.
Changing the primary endpoint: starting with “purchase conversion” but later claiming “add-to-cart” was the real goal because it is significant.
Multiple models until one works: trying different covariates, transformations, or robust methods and reporting only the favorable one without acknowledging the search.
These behaviors create a mismatch between what the p-value assumes (one planned test) and what actually happened (many tries). The result is overconfident decisions and a pipeline of “wins” that fail to replicate.
Guardrails against p-hacking: a practical operating system
You do not need perfect bureaucracy to avoid p-hacking; you need a lightweight, repeatable system that separates confirmatory decisions from exploratory learning. The goal is to make it easy to do the right thing under real business constraints.
Step-by-step: a pre-registered analysis plan (lightweight)
Before looking at results (or at least before looking at treatment differences), write a short analysis plan. It can be a ticket, a doc, or a markdown file in the experiment repo. Keep it brief but explicit:

Decision statement: “If the feature increases weekly revenue per user by at least $X without worsening refund rate by more than Y, we will roll out to 100%.”
Primary metric: one metric that drives the decision (e.g., revenue per user, activation rate). Define numerator/denominator and time window.
Guardrails: metrics that must not degrade beyond thresholds (e.g., latency, error rate, complaint rate, churn proxy).
Secondary metrics: a short list for interpretation, not for declaring success.
Population and exclusions: eligibility rules, bot filtering, employee traffic, and any outlier handling.
Analysis method: the estimator and how uncertainty is computed (e.g., difference in means with robust SE; ratio metric delta via delta method; cluster-robust if needed). Keep it stable.
Stopping rule: fixed duration or fixed sample size; if sequential monitoring is used, specify it.
Multiple comparisons plan: how you will handle multiple metrics/segments (e.g., treat secondary metrics as descriptive; adjust p-values for a defined family; or use false discovery rate for a set of planned segments).
Planned segment reads: list the segments you will examine no matter what (e.g., new vs returning; mobile vs desktop) and why.
This plan does not prevent exploration; it labels it. Confirmatory results follow the plan. Exploratory results are clearly marked as hypotheses for follow-up tests.
Step-by-step: separate “decision metrics” from “learning metrics”
Stakeholders often want one number. You can give them one number without hiding complexity by explicitly separating:
Decision metrics: primary + guardrails. These determine ship/hold/iterate.
Learning metrics: diagnostics and mechanism indicators (e.g., click-through, funnel steps, feature adoption). These explain why the primary moved (or didn’t) and guide iteration.
When teams treat learning metrics as additional chances to “win,” p-hacking becomes inevitable. When learning metrics are framed as mechanism evidence, they become valuable even when the primary is flat.
Step-by-step: handle multiple comparisons without paralysis
In real experiments you often have multiple outcomes and segments. The key is to define the “family” of tests that would lead to a decision and control error rates there, while allowing exploratory analysis elsewhere.
Option A (common and practical): one primary metric is confirmatory; everything else is descriptive. You still report uncertainty, but you do not declare success based on secondary metrics.
Option B: a small set of co-primary metrics (rare; use only if truly necessary). Apply a correction (e.g., Holm) across those co-primaries.
Option C: planned segments as a family. If you will make a decision based on “any segment wins,” you must adjust for that search. If segments are for learning, label them exploratory.
Practical rule: if a result can trigger a rollout, it must be in the confirmatory set.
Step-by-step: avoid peeking traps
Peeking is not inherently wrong; unplanned peeking is. If you must monitor, do it with a defined rule. If you cannot implement formal sequential testing, use a conservative operational approach:
Set a minimum runtime: e.g., at least 1–2 full business cycles (often weeks) to cover weekday/weekend patterns.
Set a fixed end date: do not stop early for “good news.” If you stop early for harm (guardrail breach), document it as a safety stop.
Use dashboards for health, not significance: monitor logging, sample ratio mismatch, and guardrails; avoid daily “is it significant yet?” reviews.
Interpreting p-values, confidence intervals, and practical significance
A p-value answers a narrow question: “If there were truly no effect (under the model assumptions), how surprising is this data?” It does not answer: “What is the probability the feature works?” or “How big is the business impact?” Overreliance on p-values encourages binary thinking and p-hacking.
Use intervals to talk about plausible effect sizes
Confidence intervals (or credible intervals in Bayesian workflows) are interpretation tools: they show a range of effects consistent with the data and assumptions. For decision-making, compare the interval to business thresholds:
Meaningful upside threshold: the smallest effect worth shipping given costs and risks.
Meaningful downside threshold: the largest harm you can tolerate.
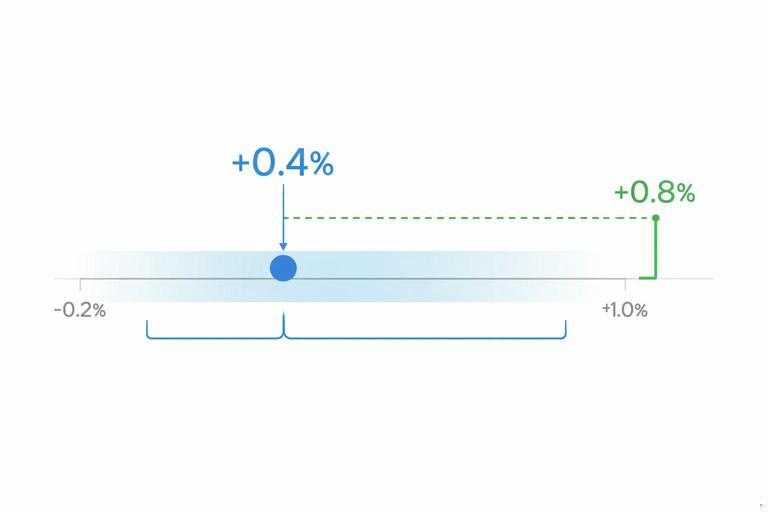
Example: suppose the primary metric is weekly revenue per user. The estimated lift is +0.4% with a 95% interval of [-0.2%, +1.0%]. Interpretation: you cannot rule out a small loss, and you also cannot confirm a lift above +1.0%. If the minimum worthwhile lift is +0.8%, this result is not strong enough to ship, even though the point estimate is positive.
Translate effects into business units
Stakeholders understand dollars, time, and risk better than standardized effect sizes. Convert the estimated effect into expected impact:
Per-user to total impact: lift × active users × time horizon.
Include uncertainty: compute a low/central/high scenario using the interval bounds.
Account for rollout scope: 10% ramp vs 100% launch changes expected value and risk exposure.
Example narrative: “At full rollout, the most likely impact is +$120k/month, with a plausible range from -$60k to +$300k.” This naturally invites a risk discussion and reduces fixation on “significant or not.”
Building a stakeholder narrative that is accurate and actionable
A strong narrative is not marketing; it is a structured explanation that connects the decision, the evidence, and the trade-offs. It should be understandable to non-technical stakeholders while remaining faithful to uncertainty and limitations.
The 6-part narrative template
1) Decision context: what decision is being made now (ship, iterate, stop, target a segment, run follow-up).
2) What changed (treatment) in plain language: describe the user experience or operational change, not the implementation details.
3) Primary result in business units: point estimate + interval + practical threshold comparison.
4) Safety/guardrails: what happened to key risks; call out any concerning movement even if not “significant.”
5) Mechanism evidence: which funnel steps or behavioral metrics moved in a way that supports (or contradicts) the hypothesized mechanism.
6) Recommendation and next step: what you propose, why, and what you will measure next.
This template prevents selective storytelling because it forces you to report the pre-specified primary and guardrails, then use secondary metrics as supporting context rather than as a substitute for the primary.
Example: turning a messy result into a clear story
Scenario: a new onboarding tooltip aims to increase activation. The primary metric is 7-day activation rate. Guardrails include support tickets and app latency.

Primary: activation lift +0.3 percentage points, interval [-0.1, +0.7]. Minimum worthwhile lift is +0.5 pp.
Guardrails: support tickets +2% interval [+0%, +4%]; latency unchanged.
Mechanism: tooltip views increased; step-2 completion increased; step-3 completion unchanged.
Narrative: “This change is unlikely to deliver the minimum worthwhile activation lift at full rollout based on current uncertainty, and it may increase support load slightly. The behavioral data suggests users notice the tooltip and complete the next step more often, but they still drop at step 3. Recommendation: do not ship as-is; iterate on step-3 guidance and run a follow-up test with the same primary metric and a support-ticket guardrail threshold.”
Notice what is absent: no cherry-picked segment win, no emphasis on a single significant secondary metric, and no claim that “it worked” because one funnel step improved.
Reporting standards that reduce misinterpretation
Always report the full set of pre-specified outcomes
If you pre-specified one primary and three guardrails, report all of them even if inconvenient. If you add exploratory metrics, label them clearly as exploratory. This simple discipline is one of the strongest anti-p-hacking practices.
Use consistent denominators and time windows
Many stakeholder disputes come from inconsistent definitions: “per session” vs “per user,” “day 0” vs “day 7,” “eligible users” vs “exposed users.” In your write-up, include a short “metric definition box” that states:
unit of analysis (user, session, account)
inclusion criteria
attribution window
how repeats are handled (first exposure, last exposure, all exposures)
Show absolute and relative changes
Relative lifts can exaggerate small baselines; absolute changes can hide scale. Provide both when possible.
Example: “Conversion increased from 2.00% to 2.06% (+0.06 pp, +3.0% relative).” This prevents stakeholders from hearing “3% lift” and imagining something larger than it is.
Prefer decision tables over dense prose
A compact table forces completeness and reduces narrative bias. A practical format:
Metric name
Baseline
Treatment
Delta (absolute and relative)
Interval
Decision threshold
Status (pass/monitor/fail)
Exploration without self-deception: how to treat surprising findings
Surprising results are valuable, but they must be handled carefully to avoid turning noise into “insight.” The rule is: exploratory findings generate hypotheses; confirmatory analyses test them.
Step-by-step: a disciplined exploration workflow
1) Log the exploration path: write down which cuts you tried (segments, metrics, filters). This creates transparency and helps avoid repeating the same search later.
2) Rank by plausibility and impact: prioritize findings that (a) align with a plausible mechanism, (b) are large enough to matter, and (c) are stable across reasonable analysis choices.
3) Check for data quality explanations: instrumentation changes, missing events, exposure misclassification, or seasonality can create fake segment effects.
4) Convert to a testable follow-up: define a new primary question for the next experiment (e.g., “effect on new users in mobile web”) and pre-specify it.
5) Avoid “retroactive segmentation” decisions: do not ship only to the segment that happened to win unless you have confirmatory evidence or a strong prior reason and accept higher risk.
How to talk about exploratory results to stakeholders
Use explicit language that signals uncertainty: “We observed,” “This suggests,” “Hypothesis,” “Needs confirmation.” Avoid language that implies proof: “This shows,” “This demonstrates,” “We found that it works for…” unless it was planned and appropriately controlled.
Handling stakeholder pressure and incentives that drive p-hacking
P-hacking is often an organizational problem: teams are rewarded for wins, roadmaps demand shipping, and leaders want certainty. You can reduce pressure by reframing what “good experimentation” means.
Replace “win rate” with “decision quality” metrics
Teams that optimize for win rate will eventually overfit. Better internal metrics include:
Replication rate: how often shipped changes maintain impact after rollout.
Forecast accuracy: how close predicted impact ranges are to observed outcomes.
Learning velocity: time from hypothesis to clear decision (ship/iterate/stop) with documented evidence.
Guardrail integrity: frequency of post-rollout incidents attributable to ignored guardrails.
Use “decision memos” to make trade-offs explicit
A decision memo is a one-page artifact that records what was known at the time of the decision. It protects teams from hindsight bias and reduces the temptation to rewrite history. Include:
primary and guardrail results with intervals
assumptions and limitations
rollout plan and monitoring plan
what would change your mind (e.g., follow-up test criteria)
Practical examples of “good” vs “bad” interpretations
Example 1: “Not significant” does not mean “no effect”
Bad: “The experiment failed; there is no impact.”
Better: “The estimate is +0.2% with an interval of [-0.6%, +1.0%]. We cannot rule out a meaningful lift or a modest loss. Given the cost to implement and the risk tolerance, we should either run longer to narrow uncertainty or deprioritize if the maximum plausible upside is still too small.”
Example 2: “Significant” does not mean “important”
Bad: “It’s significant at p<0.05, ship it.”
Better: “The lift is +0.05 pp with a tight interval. This is real but below the minimum worthwhile threshold. Shipping would add complexity without meaningful business impact.”
Example 3: Guardrails are not optional
Bad: “Revenue is up, so we can ignore the increase in refunds because it’s not significant.”
Better: “Revenue is up, but refunds moved in an unfavorable direction with a wide interval. Because refunds are a risk metric with asymmetric cost, we will ramp cautiously and run a targeted follow-up focusing on refund drivers.”
Reusable write-up structure (copy/paste)
Decision: [Ship / Hold / Iterate / Stop] because [primary vs threshold] and [guardrails status]. Treatment: [plain-language description]. Primary metric: baseline [x], treatment [y], delta [abs, rel], interval [low, high], threshold [min worthwhile]. Guardrails: [metric: delta, interval, threshold] ... Diagnostics: [sample balance, exposure integrity, missing data checks]. Mechanism/learning metrics (exploratory unless pre-specified): [what moved, what didn't]. Risks and limitations: [time window, novelty, external events, measurement constraints]. Next step: [rollout plan or follow-up experiment], success criteria: [pre-specified].This structure makes it difficult to p-hack because it forces you to state the decision criteria, report the full pre-specified set, and separate confirmatory evidence from exploratory learning.