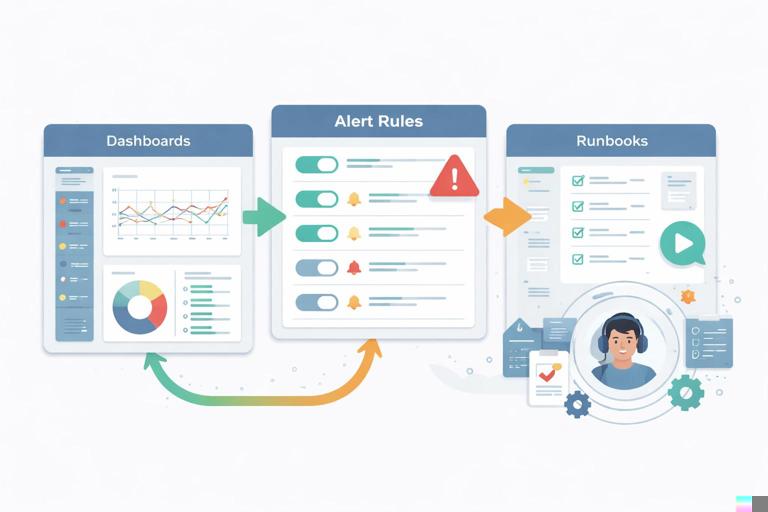
Mini-Project Goal and What You Will Build
This mini-project focuses on the operational layer that turns “we have metrics” into “we can reliably run this service”: curated dashboards, actionable alerts, and on-call runbooks tied to those alerts. You will implement a small but realistic monitoring package for the application you deployed in earlier mini-project chapters (API + worker + database), but you will not re-implement the deployment, GitOps workflow, or basic Prometheus/Grafana setup. Instead, you will add a production-grade set of artifacts that your team can review and iterate on: (1) Grafana dashboards that answer specific operational questions, (2) Prometheus alert rules that page only when there is user impact or imminent risk, and (3) runbooks that tell an on-call engineer exactly what to check and what safe mitigations exist.
By the end, you will have a repository structure like this (names are examples):
observability/ dashboards/ api-overview.json api-latency.json worker-queue.json k8s-resources.json alerts/ api-slo.rules.yaml worker.rules.yaml infra.rules.yaml runbooks/ api-high-error-rate.md api-high-latency.md worker-backlog.md pod-crashloop.md kustomization.yaml (or Helm values if you package it)The key idea is that dashboards, alerts, and runbooks are code. They should be versioned, reviewed, and deployed through the same GitOps path as everything else.
Design Principles: From Signals to Actions
Start with questions, not charts
Dashboards are most useful when each panel answers a question an operator actually asks. Examples: “Are users seeing errors?”, “Is latency increasing?”, “Is the worker keeping up?”, “Are we close to resource limits?”, “Is the database saturating?”. Avoid dashboards that are just a wall of time series.
Alerts should be actionable and sparse
An alert should fire when a human needs to do something. If the correct response is “wait, it will recover”, it should not page. Prefer multi-window burn-rate alerts for SLOs (fast burn and slow burn) and use warning-level alerts for early indicators that do not require immediate action.
- Listen to the audio with the screen off.
- Earn a certificate upon completion.
- Over 5000 courses for you to explore!

Download the app
Runbooks close the loop
Every paging alert should link to a runbook that includes: impact, likely causes, immediate checks, safe mitigations, and escalation criteria. Runbooks should reference the exact dashboards and queries used to validate hypotheses.
Use consistent labels and ownership
To make dashboards and alerts reusable, standardize labels such as namespace, app, job, and (if you have it) service. Also decide ownership boundaries: which alerts belong to the app team vs. platform team.
Step 1: Define Operational Objectives (SLOs and SLIs)
Even if you do not run a formal SRE program, you need a small set of objectives to drive alerting. For a typical API + worker system, a practical starting point is:
- API availability: successful requests / total requests.
- API latency: p95 or p99 request duration for key endpoints.
- Worker freshness: time from enqueue to completion, or backlog size and age.
- Infrastructure health: pods not ready, crash loops, CPU/memory saturation.
Pick a target that matches your environment. Example (adjust to your needs):
- API availability SLO: 99.9% over 30 days.
- API latency SLO: p95 < 300ms over 30 days for core endpoints.
Translate each SLO into an SLI query you can compute from metrics you already have. If your API exposes HTTP metrics (for example via an instrumentation library), you likely have counters like http_requests_total and histograms like http_request_duration_seconds_bucket. If your metric names differ, adapt the examples.
Step 2: Create a Dashboard Set That Matches On-Call Workflow
Create a small set of dashboards rather than one giant dashboard. A common pattern is:
- Service Overview: “Is it healthy?” (errors, latency, traffic, saturation).
- Service Deep Dive: endpoint breakdown, dependency signals.
- Worker/Queue: backlog, processing rate, failures, retries.
- Kubernetes Resources: pods, restarts, CPU/memory, throttling.
Dashboard 1: API Overview
Include panels that answer these questions:
- Is traffic normal?
- Are errors elevated?
- Is latency elevated?
- Are we saturating CPU/memory?
Example PromQL for request rate (RPS):
sum(rate(http_requests_total{app="api"}[5m])) by (namespace)Example error rate (5xx ratio):
sum(rate(http_requests_total{app="api",status=~"5.."}[5m])) / sum(rate(http_requests_total{app="api"}[5m]))Example p95 latency using histogram buckets:
histogram_quantile(0.95, sum(rate(http_request_duration_seconds_bucket{app="api"}[5m])) by (le))Example CPU usage vs requests (helps spot inefficient releases):
sum(rate(container_cpu_usage_seconds_total{namespace="$ns",pod=~"api-.*"}[5m]))In Grafana, add variables like $ns (namespace) and $cluster if you run multiple clusters. Keep panels consistent: same time range defaults, same units, and clear thresholds (for example, error ratio threshold line at 1%).
Dashboard 2: API Latency by Route
When latency alerts fire, on-call needs to know whether it is global or isolated to a route. If your metrics include a route or handler label, break down p95 by route:
topk(10, histogram_quantile(0.95, sum(rate(http_request_duration_seconds_bucket{app="api"}[5m])) by (le, route)))If you do not have route labels, use path_template or similar. Avoid raw URL paths with high cardinality.
Dashboard 3: Worker and Queue Health
Workers often fail “silently”: the API is fine, but background jobs pile up. Build panels around throughput and backlog. Depending on your queue technology, you might have metrics like queue_depth, jobs_processed_total, jobs_failed_total, or job_duration_seconds_bucket.

Example backlog depth:
max(queue_depth{app="worker"})Example processing rate:
sum(rate(jobs_processed_total{app="worker"}[5m]))Example failure ratio:
sum(rate(jobs_failed_total{app="worker"}[5m])) / sum(rate(jobs_processed_total{app="worker"}[5m]))If you can measure “oldest job age” (highly recommended), it is often more meaningful than depth:
max(queue_oldest_job_age_seconds{app="worker"})Dashboard 4: Kubernetes Resource and Pod Health (App-Focused)
This dashboard is not a generic cluster dashboard; it is scoped to your namespace and workloads. Include:
- Pod restarts over time (spot crash loops).
- Pod readiness (are replicas available?).
- CPU throttling (can explain latency).
- Memory working set (risk of OOMKills).
Example restarts:
sum(increase(kube_pod_container_status_restarts_total{namespace="$ns",pod=~"api-.*|worker-.*"}[30m])) by (pod)Example readiness:
sum(kube_pod_status_ready{namespace="$ns",condition="true",pod=~"api-.*"})Example CPU throttling ratio:
sum(rate(container_cpu_cfs_throttled_seconds_total{namespace="$ns",pod=~"api-.*"}[5m])) / sum(rate(container_cpu_usage_seconds_total{namespace="$ns",pod=~"api-.*"}[5m]))Step 3: Provision Dashboards as Code
Instead of manually creating dashboards in the UI, export them as JSON and commit them. Then configure Grafana to load dashboards from a folder via a sidecar or provisioning config (the exact mechanism depends on your existing stack). The important part is the workflow:
- Create or edit dashboard in Grafana.
- Export JSON (or use Grafana API) into
observability/dashboards/. - Review changes in PRs like any other code.
- Deploy via GitOps so every environment gets the same baseline dashboards.
Practical tip: keep dashboards environment-agnostic by using variables for namespace/cluster and by avoiding hard-coded datasource UIDs when possible. If you must reference a datasource UID, standardize it across environments.
Step 4: Implement Alert Rules That Map to User Impact
Build alerts in layers:
- SLO burn alerts (page): “We are consuming error budget too fast.”
- Symptom alerts (page or ticket): elevated 5xx, high latency, worker backlog age.
- Cause/diagnostic alerts (ticket): crash loops, OOMKills, CPU throttling, DB saturation.
API availability burn-rate alerts
Assume an availability SLO of 99.9% (error budget 0.1%). A burn-rate alert fires when you are spending error budget too quickly. A common approach is a fast and a slow alert:
- Fast burn: catch incidents quickly (short window).
- Slow burn: catch sustained degradation (longer window).
Example PrometheusRule snippet (adapt labels/metric names):
groups: - name: api-slo rules: - alert: ApiAvailabilityBurnRateFast expr: | ( sum(rate(http_requests_total{app="api",status=~"5.."}[5m])) / sum(rate(http_requests_total{app="api"}[5m])) ) > 0.01 for: 10m labels: severity: page service: api annotations: summary: "API 5xx error ratio > 1% (fast burn)" runbook_url: "https://runbooks.example.com/api-high-error-rate" - alert: ApiAvailabilityBurnRateSlow expr: | ( sum(rate(http_requests_total{app="api",status=~"5.."}[30m])) / sum(rate(http_requests_total{app="api"}[30m])) ) > 0.005 for: 1h labels: severity: page service: api annotations: summary: "API 5xx error ratio > 0.5% (slow burn)" runbook_url: "https://runbooks.example.com/api-high-error-rate"These thresholds are examples. Tune them to your normal baseline and your SLO. The key is that the alert includes a runbook_url annotation and a clear summary.
Latency alerts with guardrails
Latency alerts can be noisy if traffic is low. Add a traffic condition so you only alert when there is enough volume to be meaningful.
- alert: ApiHighLatencyP95 expr: | histogram_quantile(0.95, sum(rate(http_request_duration_seconds_bucket{app="api"}[5m])) by (le)) > 0.3 and sum(rate(http_requests_total{app="api"}[5m])) > 1 for: 15m labels: severity: page service: api annotations: summary: "API p95 latency > 300ms" runbook_url: "https://runbooks.example.com/api-high-latency"Worker backlog age alerts
Backlog depth alone is not always bad (it depends on job cost and worker count). Backlog age usually maps better to user impact (“jobs are delayed”).
- alert: WorkerBacklogTooOld expr: max(queue_oldest_job_age_seconds{app="worker"}) > 600 for: 10m labels: severity: page service: worker annotations: summary: "Oldest queued job > 10 minutes" runbook_url: "https://runbooks.example.com/worker-backlog"CrashLoop and OOMKill alerts (diagnostic)
These are often better as ticket-level alerts unless they directly impact availability. Still, they are valuable signals to catch regressions.
- alert: PodCrashLooping expr: | max_over_time(kube_pod_container_status_waiting_reason{namespace="$ns",reason="CrashLoopBackOff"}[10m]) == 1 for: 10m labels: severity: ticket service: platform annotations: summary: "Pod is CrashLoopBackOff" runbook_url: "https://runbooks.example.com/pod-crashloop"If you do not have kube_pod_container_status_waiting_reason, you can alert on restart increases:
sum(increase(kube_pod_container_status_restarts_total{namespace="$ns"}[15m])) by (pod) > 3Step 5: Route Alerts to the Right On-Call and Reduce Noise
Alert rules are only half the system; routing and grouping determine whether humans can handle the signal. Configure your alert manager (or equivalent) with:
- Grouping: group by
alertname,namespace,serviceto avoid floods. - Inhibition: if a higher-level alert is firing (for example, “API down”), suppress lower-level ones (like “latency high”).
- Severities: at minimum
pagevsticket. - Ownership: route
service=apito the app on-call,service=platformto platform on-call.
Even if you cannot implement full inhibition immediately, you can reduce noise by ensuring each alert has a for duration, traffic guards, and sensible thresholds.
Step 6: Write Runbooks That Work Under Pressure
Runbooks should be short, specific, and safe. Use a consistent template so on-call can scan quickly. Store runbooks in your repo and publish them to an internal site, or link directly to the repository path if that is what your team uses.
Runbook template
# Alert: <AlertName> ## Impact - What users experience - What is at risk (data loss? delays?) ## Triage (5 minutes) - Confirm alert is real (links to dashboard panels) - Check recent deploys/changes - Check scope (one pod? one zone? all traffic?) ## Likely causes - List 3-5 most common causes for your system ## Mitigations (safe actions) - Step-by-step actions that are low risk - What to avoid (dangerous actions) ## Verification - How to confirm recovery (metrics returning to normal) ## Escalation - When to page another team - What context to includeExample runbook: API high error rate
Include direct links to the exact dashboards and panels (Grafana supports linking to dashboards with variables). Also include concrete kubectl checks that do not require deep cluster knowledge.
# Alert: ApiAvailabilityBurnRateFast / ApiAvailabilityBurnRateSlow ## Impact Elevated 5xx responses from the API. Users may see failed requests. ## Triage (5 minutes) 1) Open dashboard: API Overview (namespace=$ns). Check: - RPS panel (is traffic normal?) - 5xx ratio panel (is it global?) - Pod restarts panel 2) Check if a rollout happened recently (last 30–60 minutes). 3) Identify whether errors correlate with a single pod: - In Grafana, break down 5xx by pod if label exists. - Or run: kubectl -n <ns> get pods -l app=api kubectl -n <ns> describe pod <pod> ## Likely causes - Bad release causing exceptions - Dependency failure (database, external API) - Resource pressure (CPU throttling, OOMKills) - Misconfiguration (feature flag, env var) ## Mitigations (safe actions) - If one pod is unhealthy: delete the pod to force reschedule: kubectl -n <ns> delete pod <pod> - If all pods are failing after a recent deploy: initiate rollback via your GitOps workflow (revert commit / promote previous version). - If CPU throttling is high: reduce load (rate limit) or scale out if permitted; open ticket to adjust requests/limits. ## Verification - 5xx ratio returns below threshold for 10–15 minutes - Restarts stop increasing - Latency stabilizes ## Escalation - If database saturation is suspected, page DB owner with: current error ratio, latency, DB metrics screenshots, and time windowExample runbook: Worker backlog too old
# Alert: WorkerBacklogTooOld ## Impact Background jobs are delayed; user-visible effects depend on job type (emails, reports, billing, etc.). ## Triage (5 minutes) 1) Open dashboard: Worker/Queue Health. Check: - Oldest job age - Processing rate - Failure ratio 2) Confirm workers are running and ready: kubectl -n <ns> get deploy worker kubectl -n <ns> get pods -l app=worker 3) Check for recent changes (deploys, config). ## Likely causes - Worker crash looping or stuck - Downstream dependency slow (DB, external API) - Job volume spike - Poison pill job causing repeated retries ## Mitigations (safe actions) - If workers are not ready: investigate pod events/logs; restart a single pod first. - If failure ratio is high: pause the job producer if you have a feature flag or config switch; otherwise reduce concurrency. - If backlog is growing but failures are low: scale workers (if allowed) and monitor saturation. ## Verification - Oldest job age decreases steadily - Processing rate exceeds enqueue rate - Failure ratio returns to baseline ## Escalation - If a dependency is failing (timeouts, 429s), page the owning team with evidence (error codes, time window, request IDs if available)Step 7: Tie Everything Together in GitOps
To make this operational package reproducible, deploy it as part of your GitOps repository. The exact manifests depend on your stack, but the pattern is consistent:
- Dashboards: ConfigMaps (or GrafanaDashboard CRDs if you use an operator) that Grafana loads automatically.
- Alerts: PrometheusRule resources (if using the Prometheus Operator) or rule files mounted into Prometheus.
- Runbooks: Markdown in repo plus a published URL; alerts reference
runbook_url.
Example skeleton using Prometheus Operator CRDs (illustrative):
apiVersion: monitoring.coreos.com/v1 kind: PrometheusRule metadata: name: api-slo namespace: observability spec: groups: - name: api-slo rules: - alert: ApiHighLatencyP95 expr: ... for: 15m labels: severity: page service: api annotations: runbook_url: https://runbooks.example.com/api-high-latencyFor dashboards as ConfigMaps, your Grafana sidecar typically watches a label like grafana_dashboard=1:
apiVersion: v1 kind: ConfigMap metadata: name: api-overview-dashboard namespace: observability labels: grafana_dashboard: "1" data: api-overview.json: | { ... exported dashboard json ... }Keep these resources in a dedicated observability folder and include them in your GitOps sync. This ensures that when you add an alert, the dashboard and runbook link ship together.
Step 8: Validate Alerts and Runbooks with Controlled Failure Tests
Before trusting alerts in production, validate them in a controlled way. The goal is not chaos engineering; it is confirming that signals fire, route correctly, and that the runbook steps actually work.
Test 1: Induce API errors safely
If your API supports a non-production endpoint or feature flag that returns 500s, use it in staging. Otherwise, you can temporarily deploy a canary configuration that forces a small percentage of requests to fail (only in staging). Validate:
- The error ratio panel shows the increase.
- The burn-rate alert fires after the expected
forduration. - The alert includes the correct labels and runbook URL.
- The on-call receiver gets a single grouped notification, not a flood.
Test 2: Induce latency
In staging, introduce artificial delay (for example, a debug flag that sleeps for 500ms on a route). Validate that the latency alert only fires when traffic is above the guard threshold.
Test 3: Worker backlog
Pause workers (scale to zero in staging) while continuing to enqueue jobs, then restore workers. Validate backlog age alerting and that the runbook steps correctly identify the issue and recovery.
Test 4: CrashLoop detection
Deploy a deliberately misconfigured worker in staging that exits immediately. Validate that your crash loop alert triggers as a ticket-level alert and that the runbook points to the right pod-level checks.
Step 9: Operational Hygiene: Ownership, Review, and Iteration
Once the initial package is in place, treat it like a living part of the system:
- PR checklist: when a service changes, update dashboards and alerts if metrics or behavior changes.
- Alert review: for each page, ask whether it was actionable and whether the runbook helped. If not, adjust thresholds, add guards, or downgrade severity.
- Dashboard drift control: avoid editing dashboards directly in production; require exporting JSON back into the repo.
- Runbook freshness: add a lightweight “last verified” field and update it after incidents or quarterly reviews.
A practical standard is: no paging alert without a runbook, and no runbook without links to the dashboards that validate each step. This keeps your on-call experience predictable and reduces time-to-mitigate when incidents happen.