What “Delay Analysis” Means in Practice
Delay analysis is the structured process of identifying (1) what happened, (2) when it happened, (3) which schedule activities were affected, (4) whether the project completion date (or interim milestones) were impacted, and (5) how much time is attributable to each delaying event. In construction, delay analysis is used for time extensions, liquidated damages evaluations, change order negotiations, and internal lessons learned. The core idea is simple: a delay is not just “something took longer.” A delay is a time impact to the planned sequence of work that affects a contractual milestone or completion date, or consumes float that was available for that work.
Two practical distinctions matter immediately:
- Delay event: the occurrence (e.g., owner-directed design change, unforeseen condition, late approval, weather shutdown, trade stacking).
- Delay effect: the measurable impact on the schedule (e.g., Activity A starts 10 days later, or the critical path shifts and the finish moves 6 days).
Good delay analysis separates the narrative (“what happened”) from the measurement (“how many days and why”), and it ties both to contemporaneous documentation.
Time impact vs. productivity impact
Not every problem is a “delay” in the schedule sense. A productivity loss (e.g., reduced output due to congestion, rework, learning curve) may increase cost without necessarily extending the project finish if there is float or if acceleration offsets it. Conversely, a delay event can be time-only (e.g., waiting for an inspection) with minimal direct cost. When documenting time impacts, be explicit about whether you are measuring (a) time extension to a milestone, (b) consumption of float, or (c) both.
Critical delay vs. non-critical delay
A delay is critical if it affects the critical path at the time it occurs (or becomes critical due to path shifts) and therefore affects the project completion date or a contractual milestone. A delay is non-critical if it affects work that has float and does not move the completion date (though it may consume float and increase risk). Your documentation should still capture non-critical delays because they often become critical later when float is exhausted.
- Listen to the audio with the screen off.
- Earn a certificate upon completion.
- Over 5000 courses for you to explore!

Download the app
Common Delay Classifications You Must Document

Delay analysis often turns into a responsibility discussion. While contract language governs, the following classifications are widely used and help you organize facts:
- Excusable: beyond the contractor’s control (e.g., unusually severe weather, owner-caused changes). Often eligible for time extension.
- Non-excusable: within the contractor’s control (e.g., poor coordination, late submittals caused by contractor). Typically not eligible for time extension.
- Compensable: owner-caused (or otherwise compensable per contract), potentially eligible for time and money.
- Non-compensable: time extension may be allowed, but no money (e.g., certain force majeure events).
- Concurrent: two or more delays overlap in time. Concurrency analysis is fact-specific and depends on contract terms and the critical path at the time.
When you document a delay event, capture enough detail to support later classification, even if you do not label it immediately.
Documentation Principles: What Makes Delay Records Credible
Contemporaneous, specific, and tied to schedule logic
The most persuasive delay documentation is created at the time of the event, is specific about dates and locations, and connects the event to the affected activities. “We were delayed” is weak. “Area B could not be closed in because the AHJ failed the rough inspection on 10/14; re-inspection occurred 10/18; drywall start shifted from 10/15 to 10/19” is strong.
One event, one record, many attachments
Create a single “delay event record” per event, then attach supporting evidence. This prevents scattered emails and photos from becoming impossible to reconstruct later.
Separate facts from opinions
Write factual statements (who, what, when, where) and keep interpretations (responsibility, entitlement) in a separate section. This reduces disputes and improves internal clarity.
The Delay Event Record (Template You Can Use)
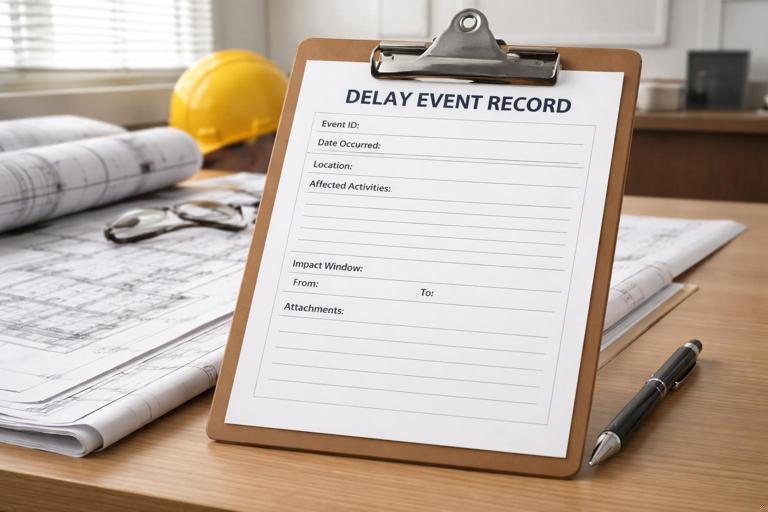
Use a standardized form so every event is captured consistently. Below is a practical structure.
- Event ID: unique number (e.g., DE-017).
- Title: short label (e.g., “Rough electrical inspection failed – Unit 204”).
- Date discovered and date occurred: not always the same.
- Location: building/area/level/gridline.
- Description (facts): what happened, by whom, and immediate consequence.
- Root cause (preliminary): unknown/owner/sub/GC/third party.
- Affected activities: activity IDs/names from the schedule update in effect.
- Impact window: start date of impact and end date (or “ongoing”).
- Type: change, RFI, submittal, inspection, access restriction, weather, differing condition, etc.
- Mitigation attempted: resequencing, overtime, added crew, alternate area, temporary works.
- Notice/communication: when notice was sent, to whom, and method.
- Attachments: daily reports, photos, inspection reports, RFI logs, emails, meeting minutes, delivery tickets.
- Schedule impact (initial): “potential,” “non-critical,” “critical,” with brief rationale.
Keep the record updated as new information arrives (e.g., approval date, re-inspection date). Treat it like a living file.
Core Source Documents for Time Impacts (What to Collect)
Daily reports and foreman logs
Daily reports are the backbone of time impact documentation. They should capture manpower by trade, work areas, completed quantities, disruptions, and reasons for lost time. If your daily report has a “delays” field, require specificity: start/stop times, area, and what work could not proceed.
Photos and videos with metadata
Photos are most useful when they show (a) the constraint, (b) the date/time, and (c) the location context. Establish a consistent naming convention (e.g., “2026-01-05_BldgA_Level2_Unit204_InspectionTag.jpg”). If possible, keep original metadata intact.
RFIs, submittals, and design clarifications
For time impacts, the key is not just the question and answer, but the cycle time and whether the work was on the critical path during that window. Preserve: date submitted, date responded, intermediate comments, and any “revise and resubmit” loops.
Meeting minutes and look-ahead constraints logs
Minutes often contain admissions (“cannot start until…”) and agreed dates. Constraints logs show when an issue was first raised and whether it was cleared on time.
Inspection reports and jurisdictional communications
Inspection failures and re-inspection dates are often decisive. Keep the inspector’s written notes, correction notices, and the re-inspection request timestamp.
Delivery tickets, shipping notices, and receiving logs
For material-related impacts, you need proof of promised dates, actual ship dates, arrival dates, and whether the material was usable upon arrival (damage, wrong spec). Tie these to the activity that required the material.
Weather records (project-specific)
Use on-site observations plus a reliable third-party record. Document whether weather actually prevented work (e.g., crane wind limits, concrete placement thresholds) rather than simply noting “rain.”
Step-by-Step: Performing a Basic Time Impact Analysis (TIA) for a Single Event

A Time Impact Analysis is a method to quantify how a specific event affects the schedule. The concept is to insert a modeled “fragnet” (a small network of activities representing the event and its consequences) into the schedule at the point in time the event occurred, then measure the change in milestone dates.
Step 1: Define the event and the impact window
Write a precise event statement and identify the period during which the event constrained work. Example: “Owner issued revised storefront details on 03/10; fabrication could not proceed until approved shop drawings were returned on 03/24.” The impact window is 03/10–03/24.
Step 2: Identify the schedule update that represents the project status just before the impact
Select the most appropriate “statused” schedule version (often the last approved update prior to the event). This matters because the critical path and float values change over time. Using the wrong update can exaggerate or understate impact.
Step 3: Identify the affected activities and logic ties
Determine which activities were directly constrained. Avoid vague mapping. If the event is “late approval,” the affected activity might be “Approve shop drawings” and the downstream activity “Fabricate storefront” and “Install storefront.” Confirm the predecessor/successor relationships that reflect how work truly flows.
Step 4: Build a fragnet that represents the event
A fragnet typically includes: (a) the delay-causing activity (e.g., “Revise details”), (b) review/approval durations, (c) rework or remobilization if applicable, and (d) any required inspections or lead-in tasks. Keep it realistic and supported by documents (email dates, review stamps, field directives).
// Example fragnet (conceptual) for a design revision event: A) Issue revised detail (duration = 0 or 1 day) B) Contractor revise shop drawings (duration = 5 days) C) Architect review/approve resubmittal (duration = 10 days) D) Release for fabrication (milestone) Logic: A -> B -> C -> D, and D becomes predecessor to “Fabricate storefront”Step 5: Insert the fragnet into the schedule at the correct time
“Correct time” means the fragnet starts when the event began to constrain progress (not when you noticed it later). If the event started mid-week, you may model it with the nearest practical data date rules used on the project, but keep a note explaining the alignment.
Step 6: Recalculate and compare milestone dates
Run the schedule calculation after insertion. Compare the impacted completion date (or milestone) to the unimpacted version. The difference is the modeled time impact, subject to concurrency and mitigation considerations.
Step 7: Test reasonableness against field records
Validate that the modeled impact matches what the field experienced. If the schedule shows a 12-day impact but crews were working unaffected in the same area, your mapping is likely wrong. Conversely, if the field was clearly stopped but the schedule shows no impact, you may have missing logic ties or the work had float at that time.
Step 8: Document mitigation and residual impact
If the team resequenced work to reduce impact, document what was done and whether it was planned or extraordinary. The time impact should reflect the net effect after reasonable mitigation that actually occurred (or that was feasible and directed, depending on contract and analysis purpose).
Step-by-Step: As-Built Delay Analysis Basics (Windows Approach)
When multiple events occur over months, a practical approach is to analyze delays in “windows” (time periods), comparing what was planned to what actually happened, and identifying which events drove critical path changes in each window.
Step 1: Choose window boundaries
Common boundaries include schedule update periods (e.g., monthly), major phase changes, or milestone-to-milestone segments. Use boundaries that align with how the project was managed and reported.
Step 2: For each window, identify the critical path at the start of the window
Record the critical path activities and near-critical paths (low float). This is essential because delays outside the critical path may not affect completion in that window.
Step 3: Compile delay events that occurred in the window
Use your delay event records and logs. For each event, note: dates, affected activities, and whether the event overlapped other events.
Step 4: Compare planned vs. actual starts/finishes for key activities
Use schedule updates and field records to identify slippages. Then connect slippages to documented events (inspection failure, access restriction, late directive). Avoid assigning cause without evidence.
Step 5: Determine which events were critical in that window
Focus on events that delayed critical path activities or caused a critical path shift. Document the mechanism: “Event X delayed Activity Y, which was driving Milestone M during this window.”
Step 6: Track critical path shifts
Critical path can move from structure to envelope to interiors. When it shifts, delays that were previously non-critical may become critical. Your window narrative should explicitly state when and why the driving path changed.
Concurrency: How to Document Overlapping Delays Without Overstating Time
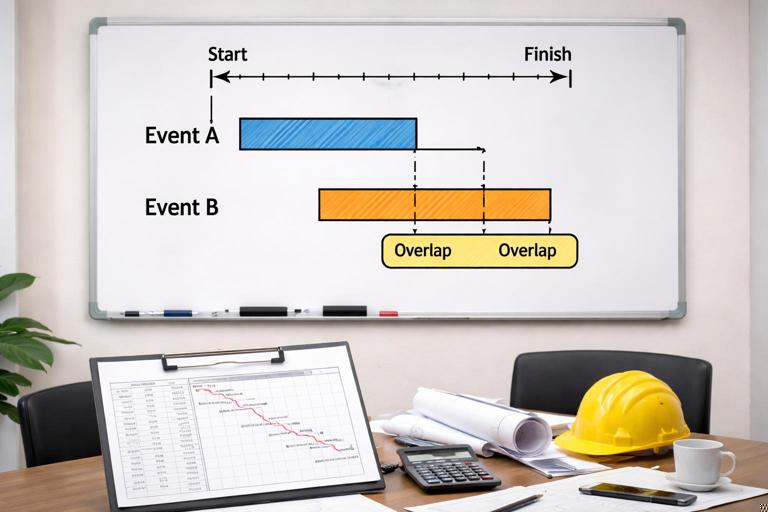
Concurrency occurs when two independent delays overlap during the same period and both affect the critical path (or would have affected it). The practical risk is double-counting days. To manage this, document concurrency in a timeline format:
- Event A: impact 04/02–04/10, affects Activity “Install drywall Level 3.”
- Event B: impact 04/05–04/12, affects Activity “Rough-in MEP Level 3.”
- Overlap: 04/05–04/10.
Then document whether both were truly critical and whether one would have delayed the project even if the other did not occur. This often requires referencing the critical path in the relevant schedule update and showing logic ties. If you cannot support concurrency with schedule logic and field records, do not assert it; instead, describe the overlap factually and flag it for further analysis.
Quantifying Time Impacts: Practical Measurement Techniques
Milestone movement
The cleanest measure is how many calendar or working days a contractual milestone moved. Document the “before” and “after” dates from schedule versions, and show the event linkage.
Float consumption
If a delay consumes float but does not move the finish date, document the float reduction. Example: “Activity had 8 days float; event consumed 6; remaining float 2.” This is valuable because it explains why later minor issues became critical.
Start/finish slippage of specific activities
Sometimes the contract focuses on interim deliverables (e.g., “area turnover”). Document the slippage of those activities even if overall completion is unchanged.
Writing the Time Impact Narrative (What to Say and How to Say It)
A strong time impact narrative is short, chronological, and cross-referenced to exhibits. Use this structure:
- Planned condition: what the schedule showed before the event (activity dates and logic).
- Event description: what happened, with dates and responsible parties (facts only).
- Immediate effect: what work could not proceed and why.
- Mitigation: what was attempted and what was feasible.
- Schedule impact: quantified days to milestone and/or float consumption, with reference to the analysis method (TIA fragnet or window analysis).
- Supporting documents: list exhibits (daily reports, RFI, directive, inspection report, photos).
Keep the language consistent: avoid “we were delayed due to…” without specifying the mechanism. Prefer “Activity X could not start because predecessor Y was not complete due to…”
Practical Example: Inspection Failure Causing a Time Impact

Scenario: Rough plumbing inspection fails in a corridor, preventing insulation and drywall, which are prerequisites for ceiling close-in and subsequent finishes.
- Event record: DE-022 “Rough plumbing inspection failed – Corridor C2.”
- Facts: Inspection on 06/11 failed; correction list issued 06/11; rework performed 06/12–06/13; re-inspection requested 06/13; passed 06/17.
- Affected activities: “Rough plumbing Corridor C2,” “Insulate Corridor C2,” “Drywall Corridor C2,” “ACT ceiling Corridor C2.”
- Impact window: 06/11–06/17 (work prevented: insulation/drywall in that corridor).
- Mitigation: drywall crew moved to Area C3 for two days; documented in daily reports.
- Schedule measurement: Insert a fragnet representing rework + re-inspection waiting time; compare milestone “Level 2 ceiling close-in complete.” If the milestone moved 3 working days, document those 3 days and show that the corridor close-in was on the driving path for that milestone during that update period.
Key documentation: inspector correction notice, re-inspection request timestamp, daily reports showing crew reassignment, photos of open ceiling, and the schedule excerpt showing logic from corridor close-in to the milestone.
Practical Example: Owner Change That Triggers Rework and Resequencing
Scenario: Owner changes door hardware set after frames are installed but before doors are hung, requiring frame prep changes and new submittal approval.
- Event record: DE-031 “Hardware set revision – Frame prep impacts.”
- Facts: Change directive issued 08/04; hardware submittal revision submitted 08/06; approved 08/18; field rework performed 08/19–08/22.
- Affected activities: “Door hardware submittal,” “Install doors and hardware,” “Punchlist – doors.”
- Impact window: 08/04–08/22.
- Mitigation: doors in unaffected areas installed first; document area-by-area resequencing in daily reports and look-ahead plans.
- Schedule measurement: Model approval duration and rework as a fragnet tied to “Install doors and hardware.” If the project finish did not move but float reduced from 12 to 2 days, document float consumption and explain increased risk to turnover.
Exhibits Package: How to Assemble a Defensible Time Impact File
For each significant event, assemble an exhibits package that can stand alone. A practical order is:
- Exhibit 1: Event summary sheet (from the delay event record).
- Exhibit 2: Schedule excerpts (before/after dates, affected activities, logic diagram if available).
- Exhibit 3: Contemporaneous communications (directive, RFI, email chain, meeting minutes excerpt).
- Exhibit 4: Field records (daily reports, manpower logs, foreman notes).
- Exhibit 5: Photos/inspection documents (with dates and locations).
- Exhibit 6: Analysis worksheet (TIA steps, assumptions, fragnet description, results).
Use consistent file naming and a simple index. The goal is that someone unfamiliar with the project can trace the event from occurrence to schedule impact without hunting across systems.
Common Pitfalls (and How to Avoid Them)
“Global” statements without activity linkage
Claiming “the project was delayed by X” without tying it to specific activities and logic is easy to challenge. Always identify the affected activities and the path to the milestone.
Using the wrong schedule version
Analyzing an event against a schedule that does not reflect the project status at the time can misstate criticality. Record the data date and version used for each analysis.
Double-counting overlapping events
If two events overlap, you cannot simply add their durations. Use a timeline and show how each event affected the driving path.
Ignoring mitigation and resequencing
If the team worked around an issue, the net time impact may be smaller. Document both the constraint and the workaround so the analysis reflects reality.
Missing “notice” trail
Many contracts require timely notice for time extensions. Even when you are not making a formal claim, document when you notified the owner/GC/CM and what you requested (direction, access, approvals). Preserve proof of transmission.