Why “the decision” must drive your definitions
In causal inference for business, you are rarely asking a generic question like “does marketing work?” You are making (or informing) a specific decision: approve a budget, change a product flow, alter pricing, adjust staffing, or target a segment. Treatments, outcomes, and metrics must be defined so that the causal effect you estimate corresponds to the action you can actually take and the result you actually care about. When definitions drift away from the decision, you can end up with an effect estimate that is technically correct for a different question, but useless—or even harmful—for the real one.
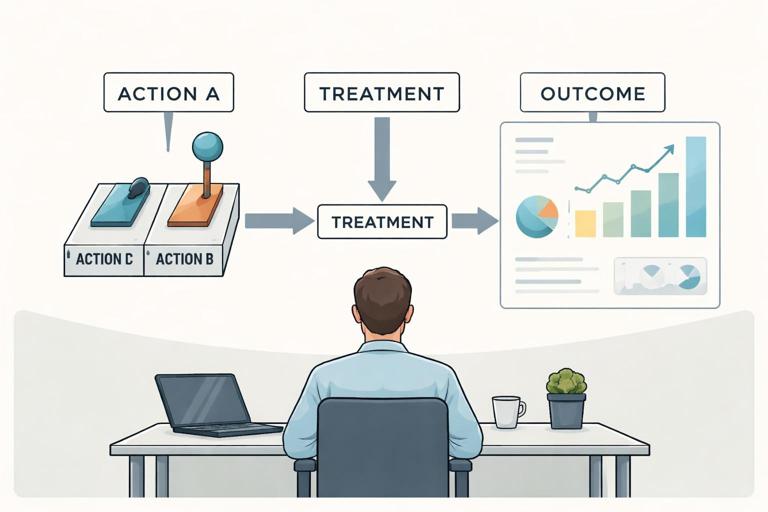
A practical way to keep alignment is to phrase the decision as: “If we choose action A instead of action B, what will happen to outcome Y over time horizon T, for population P, under constraints C?” This chapter focuses on turning that sentence into precise definitions of treatment, outcome, and metrics, plus the operational details needed to measure them consistently.
Defining the treatment: what exactly is the action?
Treatment is an intervention you can control
A treatment is the actionable change you can implement: a new onboarding flow, a discount policy, a call script, a recommendation algorithm, a fraud rule threshold, a delivery promise, or an email cadence. The key is controllability. If you cannot reliably set it (or set it for the right units), it is not a treatment; it is a condition or an observation.
Example: “Users who watch a demo video convert more” is not a treatment unless you can intervene to cause users to watch the video (e.g., by auto-playing it or gating steps). The treatment should be “show auto-play demo video on step 2” rather than “video watched.”
Specify the unit of intervention
Define the unit that receives the treatment: customer, account, session, order, store, region, sales rep, or day. The unit must match how the decision is applied. If the decision is “roll out to stores,” the unit is likely store, not customer. If the decision is “change ranking algorithm,” the unit might be user-session or user-day, depending on exposure and measurement.
- Listen to the audio with the screen off.
- Earn a certificate upon completion.
- Over 5000 courses for you to explore!

Download the app
- Customer-level treatment: a retention offer sent to a customer.
- Account-level treatment: a new pricing plan applied to an account.
- Store-level treatment: staffing increase in a store.
- Region-level treatment: a new delivery partner in a city.
Define treatment versions and intensity (avoid “bundle ambiguity”)
Many business actions are bundles: “new onboarding” may include copy changes, fewer fields, different default settings, and a new email follow-up. If you define the treatment as “new onboarding,” your effect estimate will be hard to interpret and hard to reproduce. Instead, define the treatment as a specific versioned package, or separate components if you need component-level decisions.
Also define intensity or dosage when relevant: number of emails, discount percentage, frequency of push notifications, call duration, or ad spend level. If the decision is “increase spend from $X to $Y,” the treatment is not “marketing on/off” but a spend level change.
- Binary treatment: feature enabled vs disabled.
- Multi-valued treatment: discount at 0%, 10%, 20%.
- Continuous treatment: bid multiplier, staffing hours, credit limit.
Define the control condition explicitly
Control is not “nothing happens.” Control is the alternative action you would take if you do not implement the treatment. Often this is “business as usual,” but you must specify what that means operationally: the current algorithm version, the current email cadence, the current staffing schedule, the current eligibility rules.
Be careful when “business as usual” is changing over time (e.g., seasonal promotions). If the baseline is drifting, your control definition should include the exact baseline policy during the experiment window.
Timing: start, duration, and exposure
Define when treatment starts, how long it persists, and what counts as exposure. For a UI change, exposure might be “user sees the new page at least once.” For a pricing change, exposure might be “account renews under the new plan.” For staffing, exposure might be “store operates with added staff hours for at least N shifts.”
Timing definitions prevent common errors like attributing outcomes that occurred before exposure, or mixing short-term novelty effects with steady-state effects.
Interference and spillovers: when one unit affects another
Many business treatments create spillovers: a discount to one customer can change inventory availability for others; a new ranking algorithm can shift seller revenue across the marketplace; a staffing increase in one store can pull demand from nearby stores. If spillovers are plausible, define treatment at a higher level (e.g., region instead of customer) or define metrics that explicitly account for system-level effects (e.g., total marketplace GMV, not just treated-seller GMV).
Defining outcomes: what result matters for the decision?

Outcome must reflect the business objective, not just a convenient proxy
Outcomes are the variables you want to change: revenue, profit, retention, conversion, churn, fraud loss, delivery time, customer satisfaction, safety incidents. The best outcome is the one that directly matches the decision’s objective and constraints.
Convenient proxies (click-through rate, time on site, app opens) are tempting because they are fast and abundant, but they can mislead if they are not tightly linked to the objective. If the decision is about profitability, an outcome like “orders” can be misleading if it increases low-margin orders or increases returns.
Single primary outcome vs a metric set
For most decisions, define one primary outcome that determines success, plus a small set of guardrail outcomes that prevent harm. This reduces “metric shopping” and makes trade-offs explicit.
- Primary: incremental profit per eligible user over 30 days.
- Guardrails: refund rate, customer support contacts, delivery SLA breaches, NPS complaints, fraud rate.
Time horizon: immediate, medium-term, long-term
Outcomes must be measured over a time horizon that matches how value is realized. A retention intervention might look great at 7 days but fade by 60 days. A pricing change might reduce conversions immediately but increase long-term revenue per customer. Define the horizon up front and justify it based on the decision cycle.
Common horizons include: same session, 7-day, 28-day, 90-day, renewal cycle, or lifetime value (LTV) windows. If you cannot wait for full LTV, define a validated leading indicator (e.g., 30-day gross margin) and treat it as a decision proxy with known limitations.
Outcome definition must be operational and unambiguous
Write outcomes as measurable formulas tied to data sources. “Customer satisfaction” is ambiguous; “CSAT score from post-chat survey within 24 hours” is operational. “Churn” is ambiguous; “no paid activity for 60 consecutive days” is operational.
Include inclusion/exclusion rules: which transactions count, which refunds count, how to handle partial cancellations, and how to treat missing surveys.
From outcomes to metrics: turning objectives into measurable quantities
Choose metrics that match the decision’s objective function
A decision typically optimizes something like profit, risk-adjusted profit, or cost subject to constraints. Your metric should approximate that objective function. If you optimize a proxy that is not aligned, you will push the system in the wrong direction.
Example: If the decision is “increase free shipping eligibility,” optimizing conversion rate alone can increase shipping costs more than revenue. A better primary metric is incremental contribution margin (revenue minus variable costs) per visitor or per eligible customer.
Define the estimand in business terms
Even without using formal causal diagram language, you should define what effect you want to estimate in terms of a comparison between treatment and control for a specific population and time window.
- Population: all new users in the US who reach onboarding step 1.
- Intervention: new onboarding flow version v3.
- Comparator: current onboarding flow v2.
- Outcome: 28-day contribution margin per user.
This definition guides instrumentation, experiment design, and analysis choices.
Metric design patterns (with examples)
- Per-unit metrics: revenue per user, profit per order, tickets per agent-hour. Useful when treatment is applied at that unit.
- Rate metrics: conversion rate, churn rate, defect rate. Ensure denominator is stable and not itself manipulated in a misleading way.
- Time-to-event metrics: time to first purchase, time to resolution. Define censoring rules and maximum observation windows.
- Composite metrics: weighted score combining multiple objectives (e.g., profit minus penalty for SLA breaches). Use only when trade-offs are agreed and weights are defensible.
Guardrails and “do no harm” constraints
Guardrails are metrics that must not degrade beyond a threshold even if the primary metric improves. They translate constraints into measurable checks. For example, a fraud model might increase approval rate (primary) but must keep chargeback rate below a fixed limit (guardrail). A support automation change might reduce cost per ticket (primary) but must not increase repeat contact rate (guardrail).
Define guardrails with clear thresholds and measurement windows, and decide in advance what action to take if guardrails fail (rollback, partial rollout, or iterate).
Step-by-step: a practical workflow to define treatments, outcomes, and metrics

Step 1: Write the decision statement
Use a structured template:
- Decision: what action will we choose?
- Options: treatment vs control (or multiple treatments).
- Population: who/what is affected?
- Objective: what are we optimizing?
- Constraints: what must not get worse?
- Time horizon: when do we measure impact?
Example: “Should we offer 15% discounts to at-risk subscribers (vs no discount) to maximize 60-day incremental contribution margin, while keeping refund rate and support contacts within acceptable bounds?”
Step 2: Define the treatment as an implementable policy
Write the treatment as a policy rule that engineering or operations can implement:
- Eligibility: who can receive it (e.g., at-risk score > 0.7, not already discounted).
- Action: what exactly happens (15% discount applied at renewal, communicated via email template X).
- Timing: when it triggers (7 days before renewal).
- Versioning: policy id, template id, pricing rule id.
Include what happens in control: “no discount; standard renewal email template Y.”
Step 3: Define the primary outcome and its formula
Translate the objective into a measurable formula. For contribution margin:
ContributionMargin_60d = Revenue_60d - VariableCosts_60d - DiscountCost_60d - IncrementalSupportCost_60dDecide what is included in each term and how it is computed. If some components are not measurable in time (e.g., long-term returns), document the approximation and add a guardrail.
Step 4: Choose the metric scale and aggregation
Decide whether you will measure per eligible user, per treated user, per account, or per region. This must match the unit of decision and the unit of randomization/rollout. If the decision is “roll out to all eligible users,” a per-eligible-user metric is often appropriate because it incorporates both uptake and effect.
Also decide how to aggregate: mean, median, trimmed mean, winsorized mean, or ratio of sums. Heavy-tailed revenue distributions often require robust choices (e.g., winsorization) to avoid a few extreme values dominating the result.
Step 5: Define guardrails and diagnostic metrics
Guardrails protect against unintended consequences; diagnostics help interpret mechanisms without becoming success criteria.
- Guardrails: refund rate, chargeback rate, complaint rate, delivery SLA, unsubscribe rate.
- Diagnostics: email open rate, click rate, discount redemption rate, time to renewal.
Diagnostics can explain why the primary metric moved, but should not replace it as the decision metric.
Step 6: Specify measurement windows and attribution rules
Define when outcomes start counting (e.g., from first exposure or from assignment), and how to attribute events that happen later. For example, if a user is assigned to treatment but never sees the email, do you count them? For decision-making about rollout, counting all assigned eligible users often matches the real-world effect of deploying the policy (because not everyone will engage). If you are evaluating the effect among compliers, that is a different estimand and should be labeled clearly.
Define event inclusion rules such as:
- Count purchases within 60 days of assignment.
- Exclude fraudulent transactions identified within 30 days.
- Include refunds that occur within 90 days but are tied to purchases in the 60-day window.
Step 7: Validate instrumentability and data quality
Before running anything, confirm you can measure treatment exposure and outcomes reliably:
- Logging: treatment assignment id, exposure timestamp, version ids.
- Join keys: stable user/account identifiers across systems.
- Latency: when revenue/cost/refund data becomes final.
- Missingness: survey response rates, tracking loss, offline conversions.
Create a simple “metric spec” document that includes SQL definitions or data dictionary references so the metric is reproducible.
Common pitfalls and how to avoid them
Pitfall 1: Defining treatment as a post-treatment behavior
“Watched video,” “clicked email,” “used feature,” and “accepted offer” are behaviors that occur after exposure and are influenced by the treatment. If you define the treatment as these behaviors, you risk answering a different question: the effect of engagement rather than the effect of the policy you can deploy.
Fix: define treatment as the policy-controlled exposure (e.g., “video auto-plays” or “email sent with subject line A”), and treat engagement as a diagnostic or as part of a separate analysis clearly labeled as such.
Pitfall 2: Choosing a metric that can be gamed by changing the denominator
Rate metrics can improve because the denominator shrinks. Example: “conversion rate” can increase if you filter out low-intent traffic, even if total conversions fall. Similarly, “defect rate” can drop if fewer items are inspected.
Fix: pair rate metrics with volume metrics (e.g., conversions per eligible user, total conversions, total revenue) and ensure the denominator corresponds to the decision scope (eligible population).
Pitfall 3: Misaligned time horizons
A short horizon can miss delayed harms (e.g., increased churn after aggressive upsell) or delayed benefits (e.g., improved retention from better onboarding). A long horizon can delay decisions unnecessarily.
Fix: define a primary horizon that matches the decision cycle, plus a monitoring plan for longer-term outcomes. If using a leading indicator, document why it is acceptable and what risks remain.
Pitfall 4: Ignoring costs and constraints
Many experiments optimize top-line metrics and later discover margin erosion, operational overload, or compliance issues.
Fix: incorporate variable costs into the primary outcome when the decision is economic, and define guardrails for operational capacity (e.g., support tickets per agent-hour, warehouse pick rate, delivery backlog).
Pitfall 5: Vague definitions that cannot be implemented consistently
“High-value customers,” “at-risk users,” or “quality leads” can mean different things to different teams. If the treatment targets a segment, the segment definition is part of the treatment.
Fix: define segments with explicit rules (thresholds, lookback windows, features) and version them. Example: “At-risk = churn model v5 score > 0.72 computed daily at 02:00 UTC using features from the prior 30 days.”
Worked examples: aligning definitions to real decisions

Example 1: Product onboarding change
Decision: roll out a simplified signup flow?
- Treatment: Signup flow v3 (remove optional fields, add SSO button, default to monthly plan view). Exposure = user lands on signup page while assigned.
- Control: Signup flow v2.
- Primary outcome: 28-day activated-and-retained users per 1,000 signup page visitors (activation defined as completing key action within 7 days; retention defined as at least 2 active days in weeks 3–4).
- Guardrails: fraud signups per 1,000 visitors, support contacts per activated user, payment failure rate.
- Diagnostics: form completion rate, time to complete signup, SSO usage rate.
Note how the primary outcome is not just “signup completion” (a near-term proxy) but a metric closer to the decision objective: creating retained users.
Example 2: Sales outreach cadence
Decision: increase outbound touches from 3 to 5 for mid-market leads?
- Unit: lead (or account) depending on how outreach is coordinated.
- Treatment: cadence policy = 5 touches in 10 business days using templates A/B/C and call attempts schedule; assigned at lead creation.
- Control: cadence policy = 3 touches in 10 business days.
- Primary outcome: gross profit from closed-won deals within 90 days per lead assigned.
- Guardrails: unsubscribe/complaint rate, rep workload (touches per rep-day), lead response time.
- Diagnostics: reply rate, meeting set rate, time to first response.
This avoids optimizing “meetings set” if meetings are low quality, and it forces inclusion of rep capacity as a constraint.
Example 3: Marketplace ranking change with spillovers
Decision: change ranking to promote faster-shipping sellers?
- Treatment: ranking algorithm v12 with shipping-speed feature weight increased; exposure = search sessions served by v12.
- Control: ranking algorithm v11.
- Primary outcome: total contribution margin per 1,000 search sessions (captures system-level effects).
- Guardrails: cancellation rate, late delivery rate, seller churn, customer complaint rate.
- Diagnostics: click distribution across sellers, average shipping promise shown, share of impressions to top sellers.
Because ranking reallocates demand across sellers, system-level metrics help avoid the trap of measuring only treated sellers’ gains while ignoring others’ losses.
Creating a metric specification (a reusable artifact)
To make definitions durable and auditable, create a metric spec that includes:
- Name and purpose: “28-day contribution margin per eligible user; primary decision metric for onboarding v3 rollout.”
- Unit and population: eligible users; include/exclude rules.
- Treatment/control definitions: policy ids, version ids, exposure rules.
- Outcome formula: explicit components and data sources.
- Time windows: assignment date, exposure date, observation window, refund window.
- Aggregation: mean/winsorized mean; handling outliers.
- Data quality checks: expected counts, missingness thresholds, logging validation queries.
- Guardrails and thresholds: definitions and rollback criteria.
This spec prevents silent metric drift, enables consistent analysis across teams, and makes it clear what the estimated effect means in decision terms.