What “Decision Intelligence” Means When You Treat Business as a Causal System
In many organizations, “decision intelligence” is interpreted as better dashboards, more predictive models, or faster reporting. Those tools help, but they often leave a gap: predictions can be accurate while decisions still disappoint. The missing link is causality. Decision intelligence becomes most useful when it is framed as causal thinking for business outcomes: a disciplined way to choose actions based on what they will change, not merely what they correlate with.
Causal decision intelligence asks a practical question: “If we do X, what will happen to Y, compared with not doing X?” This is different from “Who is likely to churn?” (prediction) or “What segments have low retention?” (description). A churn prediction model may identify customers at risk, but it does not automatically tell you which intervention will reduce churn, for whom, and at what cost. Causal thinking turns analytics into a decision system by explicitly modeling interventions, counterfactuals, and trade-offs.
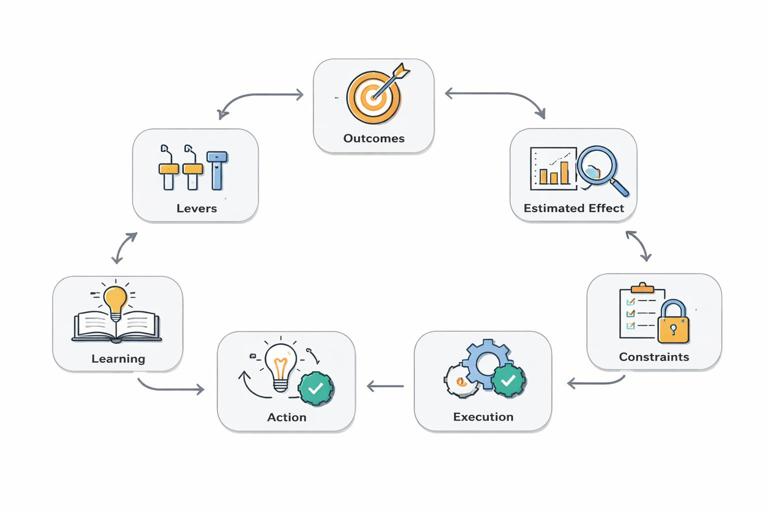
In business terms, causal decision intelligence is a loop: define an outcome, identify controllable levers, estimate the effect of pulling each lever, choose the best action under constraints, execute, and learn. The core shift is that you treat the company as a system of cause-and-effect relationships rather than a set of metrics that move together.
From “What’s Associated?” to “What’s Actionable?”
Correlation-based analysis is often good at ranking: which customers are high value, which channels are high converting, which stores have higher sales. But decisions require more than ranking; they require knowing what will change when you intervene. Many business mistakes happen when teams act on associations that are not causal.
Common correlation traps in business
- Targeting the wrong lever: You observe that customers who open emails have higher retention, so you push more emails. But opening emails may be a proxy for engagement; emailing more may not create engagement and could even increase unsubscribes.
- Misreading channel performance: You see that paid search customers have higher lifetime value than social customers, so you shift budget to search. But search may capture already-intent customers who would have purchased anyway; the incremental lift could be small.
- Confusing selection with impact: Stores with more staff have higher sales, so you add staff everywhere. But high-traffic stores are staffed more; staffing may not be the driver.
Causal decision intelligence forces you to separate selection effects (who ends up exposed to something) from treatment effects (what exposure does). This separation is what makes recommendations actionable.
- Listen to the audio with the screen off.
- Earn a certificate upon completion.
- Over 5000 courses for you to explore!

Download the app
Business Outcomes as Causal Targets
To use causal thinking, you need to define outcomes in a way that supports decisions. A good outcome is measurable, time-bounded, and tied to value. Examples include conversion within 7 days, churn within 90 days, average order value next month, support cost per user, or on-time delivery rate.
Then you define the decision (the action you can take) and the intervention (how the action changes the world). Examples:
- Decision: offer a discount vs. not. Intervention: price reduction applied at checkout for eligible users.
- Decision: route leads to sales vs. self-serve. Intervention: assign a rep and schedule outreach within 24 hours.
- Decision: change onboarding flow. Intervention: new sequence of steps and prompts shown to new users.
- Decision: increase delivery promise accuracy. Intervention: update ETA model and customer messaging rules.
Notice that the intervention must be operationally specific. “Improve onboarding” is not an intervention; “replace step 3 with guided setup and add an in-app checklist” is.
The Causal Decision Canvas (Practical Structure)
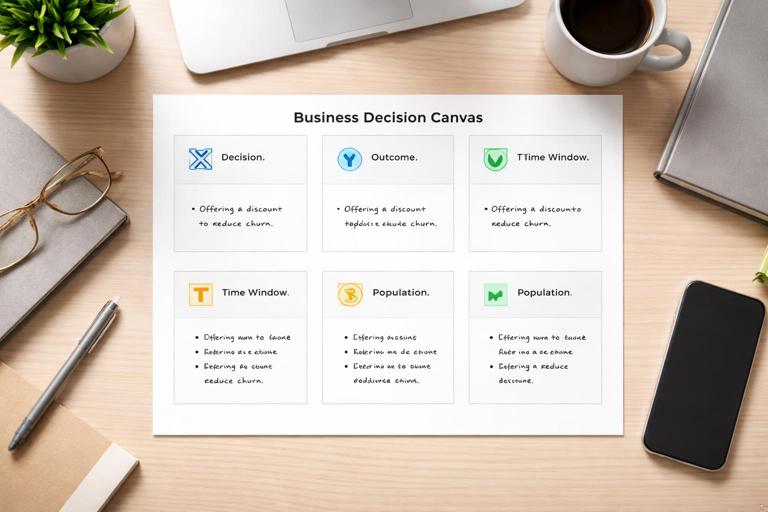
A practical way to implement decision intelligence as causal thinking is to use a lightweight “causal decision canvas” before building models or running tests. The goal is to make assumptions explicit and to connect data work to a decision.
Step 1: State the decision and the outcome
Write a single sentence: “We will decide X to improve Y over time window T for population P.”
- X (decision): what you can control (e.g., send a retention offer).
- Y (outcome): what you measure (e.g., churn within 60 days).
- T: the evaluation horizon (e.g., 60 days).
- P: who is eligible (e.g., customers with declining usage).
Example: “We will decide whether to offer 15% off to reduce churn within 60 days for monthly subscribers who have had two consecutive weeks of declining usage.”
Step 2: Define the intervention precisely
Specify the treatment and the alternative (control). Include timing, channel, eligibility, and any constraints.
- Treatment: “Show discount offer in-app on day 0; valid for 7 days; applies to next renewal.”
- Control: “No discount offer; standard messaging only.”
This precision prevents later ambiguity like “some users saw it” or “sales reps applied it differently,” which can break causal interpretation.
Step 3: Map a simple causal graph in words
You do not need a formal diagram to start; a written causal map is enough to align stakeholders. List:
- Drivers of the outcome (e.g., product value, price sensitivity, customer support experience).
- Drivers of treatment assignment (e.g., who gets targeted, rep discretion, eligibility rules).
- Variables affected by the treatment (mediators) (e.g., perceived value, usage, renewal decision).
Example causal story: “Declining usage increases churn risk and also triggers the discount offer. Usage is influenced by seasonality and by support tickets. The discount may reduce churn directly by lowering price and indirectly by motivating re-engagement.”
This step helps identify confounders: factors that influence both who gets treated and the outcome.
Step 4: Identify what you can measure and what you cannot
List available data sources (product events, CRM, billing, support, marketing) and note gaps (e.g., competitor offers, offline behavior). Causal decision intelligence is not about perfect knowledge; it is about making uncertainty explicit and designing around it.
Step 5: Choose the estimand: what effect do you need?
Different decisions require different causal quantities. Common business estimands include:
- Average treatment effect (ATE): overall impact if applied broadly.
- Effect on the treated (ATT): impact for those who actually receive the intervention (useful when rollout is selective).
- Conditional effects (heterogeneous treatment effects): impact by segment (e.g., new vs. tenured customers).
- Incremental ROI: effect on profit after costs, not just on the outcome metric.
Example: If the discount is expensive, you may care less about ATE and more about “incremental profit per treated customer” and “which segments have positive lift.”
Step 6: Decide how you will learn: experiment, quasi-experiment, or policy learning
Decision intelligence does not mandate one method; it mandates that the method matches the decision and constraints. If you can randomize, do so. If you cannot, you need a design that approximates the counterfactual. If you are choosing among multiple actions, you may need a policy that assigns treatments based on predicted uplift and constraints.
Step-by-Step: Turning a Business Question into a Causal Decision System
The following workflow is practical for product, marketing, operations, and revenue teams. It focuses on building a repeatable decision system rather than a one-off analysis.
Step 1: Translate the business goal into a decision portfolio
Most outcomes can be influenced by multiple levers. List candidate interventions and treat them as a portfolio. For churn reduction, interventions might include: proactive support outreach, onboarding improvements, pricing changes, feature education, or contract terms. Decision intelligence compares these interventions on expected impact and cost.
Deliverable: a table of interventions with (a) owner, (b) target population, (c) expected mechanism, (d) cost, (e) risks.
Step 2: Specify guardrails and constraints
Business decisions are rarely single-metric. Add guardrails such as margin, customer satisfaction, complaint rate, or operational capacity. Constraints might include budget, rep bandwidth, inventory, or legal restrictions.
Example: “Discount offers must not reduce gross margin below 40%,” or “Support outreach capacity is 2,000 customers/week.”
Step 3: Define the counterfactual and the baseline policy
Every causal claim compares to something. Define what “no intervention” means in reality: the current policy, not an imaginary world. If the current policy already includes some outreach, then your counterfactual is “current outreach rules,” not “no outreach.”
This matters because the effect you estimate is incremental to the baseline policy.
Step 4: Build an outcome model only after the causal question is clear
Predictive models are still useful, but in causal decision intelligence they serve specific roles:
- Eligibility and targeting: identify who is at risk or who is likely to respond.
- Adjustment: control for confounders when estimating effects (when appropriate).
- Forecasting value: translate outcome changes into revenue or cost impact.
A common mistake is to start with a churn model and then search for actions. Instead, start with actions and then use models to estimate their causal impact.
Step 5: Estimate effects and uncertainty in decision terms
Decision intelligence requires uncertainty to be visible. Report effects with intervals and translate them into business units: incremental revenue, cost savings, or profit.
Example: “Offering 15% off to the eligible group is estimated to reduce 60-day churn by 1.2–2.0 percentage points, with an expected incremental profit of $3.10–$6.40 per treated customer after discount cost.”
This framing supports decisions under risk: you can compare interventions by expected value and downside.
Step 6: Choose a policy and implement with feedback
A policy is a rule for assigning actions. It can be simple (treat everyone eligible) or targeted (treat only those with positive expected uplift and acceptable margin impact). Implementation should include:
- Instrumentation to confirm who received what and when.
- Monitoring of guardrails (e.g., margin, NPS, complaint rate).
- Periodic recalibration as customer behavior changes.
Practical Example 1: Marketing Spend Allocation as a Causal Decision
Scenario: A subscription business wants to reallocate marketing budget across channels to increase net new subscribers while maintaining CAC targets.
Decision framing
- Decision X: allocate an additional $100k/month across channels A, B, C.
- Outcome Y: incremental subscriptions and incremental profit over 90 days.
- Constraints: CAC must remain below $120; brand search impression share must not drop below a threshold.
Causal thinking
Observed ROAS by channel is not necessarily causal because channels differ in intent and attribution. The causal question is: “If we increase spend in channel B by $1, what incremental conversions occur compared with not increasing spend?”
Step-by-step implementation
- 1) Define intervention: increase bids/budget in a controlled way for a subset of geographies or time blocks.
- 2) Define baseline: current spend policy and bid rules.
- 3) Choose design: geo split or time-based holdouts where feasible; ensure other marketing changes are held constant.
- 4) Measure outcomes: incremental subscriptions, downstream retention, and margin impact; include spillovers like organic lift or cannibalization.
- 5) Decide policy: allocate budget to channels with highest incremental profit per dollar, not highest attributed ROAS.
Decision intelligence output: a budget allocation rule with expected incremental profit and uncertainty bounds, plus monitoring triggers (e.g., if marginal CAC rises above threshold, reduce spend).

Practical Example 2: Sales Outreach Prioritization as Uplift, Not Propensity
Scenario: A B2B company has limited SDR capacity and wants to prioritize outreach to maximize pipeline creation.
Common non-causal approach
Rank leads by propensity to convert (likelihood to become an opportunity). This often prioritizes leads that would convert anyway (inbound, high intent), wasting SDR time on low incremental impact.
Causal decision approach
The causal question is: “For which leads does SDR outreach create incremental pipeline compared with no outreach?” That is an uplift question.
Step-by-step implementation
- 1) Define treatment: SDR outreach within 24 hours with a standard sequence.
- 2) Define control: no SDR outreach; lead remains in marketing nurture.
- 3) Define outcome: opportunity created within 30 days; optionally expected revenue within 180 days.
- 4) Account for constraints: SDR capacity per week; fairness constraints (e.g., do not systematically ignore certain regions if that violates policy).
- 5) Estimate uplift: measure incremental opportunity creation by segment; identify “persuadables” (high uplift), “sure things” (high propensity but low uplift), and “lost causes” (low both).
- 6) Deploy policy: prioritize high-uplift leads until capacity is filled; keep a small exploration budget to learn in uncertain segments.
Decision intelligence output: a routing policy that maximizes incremental pipeline per SDR hour, with guardrails on lead response time and rep workload.
Practical Example 3: Operational Decisions and Causal Trade-offs (Support Triage)
Scenario: A support team wants to reduce resolution time and churn. They consider prioritizing tickets from high-value customers.
Causal framing
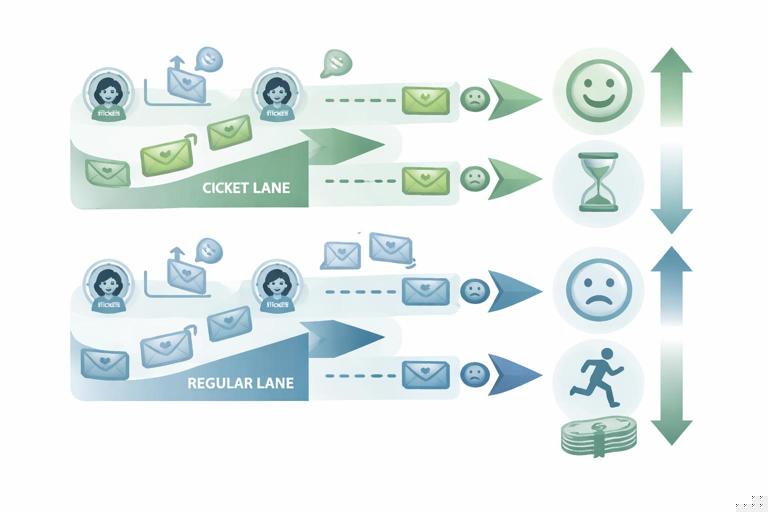
Prioritization changes waiting time, which changes satisfaction, which may change churn. But prioritizing one group increases waiting time for others. The causal question becomes multi-outcome: “What is the effect of priority routing on churn and cost, accounting for spillovers?”
Step-by-step implementation
- 1) Define intervention: new triage rule that routes high-value customers to a fast lane.
- 2) Define outcomes: time to first response, resolution time, CSAT, churn within 90 days, agent utilization.
- 3) Identify spillovers: low-value customers may experience longer waits; measure their churn too.
- 4) Choose policy: set a cap on fast-lane volume so overall queue stability remains acceptable.
- 5) Monitor guardrails: if low-value churn increases beyond a threshold, adjust routing.
Decision intelligence output: a triage policy that balances causal effects across segments and respects operational constraints.
How to Communicate Causal Decisions to Stakeholders
Decision intelligence succeeds when it is understandable to decision-makers. Use a consistent “decision memo” format that ties causal estimates to action.
Decision memo template
- Decision: what action will be taken and for whom.
- Objective: primary outcome and time window.
- Alternatives considered: other interventions and why they were not chosen.
- Estimated impact: effect size with uncertainty; translate into revenue/cost.
- Costs and risks: operational cost, customer experience risk, compliance risk.
- Guardrails: metrics that must not degrade.
- Rollout plan: phased deployment, monitoring, and learning plan.
This format keeps the focus on causal impact and decision quality rather than model sophistication.
Implementation Details That Make Causal Decision Intelligence Work
Operationalize “treatment” as a logged event
If you cannot reliably measure who received the intervention, causal analysis becomes fragile. Ensure that every intervention is logged with: timestamp, version, channel, eligibility criteria, and any human overrides. For sales or support actions, log rep assignment and contact attempts.
Separate “eligibility,” “assignment,” and “exposure”
In real systems, not everyone eligible is assigned, and not everyone assigned is exposed (e.g., email not delivered, user never opens app). Decision intelligence benefits from tracking these stages explicitly because the effect of assignment can differ from the effect of exposure. This also helps diagnose implementation failures: the intervention may be effective, but delivery may be poor.
Design for iteration: small changes, fast learning
Causal decision intelligence is a continuous process. Interventions evolve (new creatives, new scripts, new product flows). Treat each meaningful change as a new version and measure its incremental effect. This avoids “set and forget” policies that drift as markets change.
Connect effects to unit economics
Business decisions require translating outcome changes into value. A 1 percentage point churn reduction is not inherently good or bad; it depends on customer lifetime value, discount costs, operational costs, and capacity. Build a simple value model that converts causal effects into incremental profit and includes uncertainty.
Minimal Technical Backbone (Without Overbuilding)
You can implement causal decision intelligence without building a complex platform on day one. A minimal backbone includes:
- A decision registry: a shared document or system listing interventions, owners, target populations, and status.
- Event logging: consistent tracking of treatment assignment and exposure.
- Outcome tables: standardized definitions for key outcomes (conversion, churn, margin, SLA).
- Policy evaluation cadence: weekly or monthly review of estimated impact, guardrails, and recommended adjustments.
As maturity grows, teams can add automation: policy engines, uplift models, constraint optimization, and continuous monitoring. The causal framing remains the same: decisions are evaluated by their incremental effect on outcomes under constraints.
Checklist: Is Your Analytics Work Actually Decision Intelligence?
Use this checklist to verify that a project is truly causal decision intelligence rather than reporting or prediction alone:
- Is there a clearly stated decision (an action someone will take)?
- Is the intervention operationally defined (who, what, when, how)?
- Is the comparison baseline explicit (current policy)?
- Are confounding drivers of assignment and outcome identified?
- Is the effect reported in decision units (profit, cost, capacity), with uncertainty?
- Are guardrails and constraints defined and monitored?
- Is there a plan to learn and update the policy over time?
If several items are missing, the work may still be valuable, but it is not yet a causal decision system. The goal is to move from “insights” to “interventions with measured impact.”