Why Power Query Matters for Data Storytelling
Goal: turn messy, inconsistent source data into a clean, reliable model input that supports accurate measures and clear visuals. Power Query is the data preparation layer in Power BI where you shape data before it reaches the model. The key idea is that every transformation becomes a repeatable step, so refreshes produce the same clean result without manual rework.
What Power Query is (and is not): Power Query uses the M language under the hood to record transformations. It is optimized for shaping data (filtering, splitting, merging, type enforcement, standardization), not for building relationships or DAX measures. Think of it as the “kitchen prep” stage: you wash, cut, and portion ingredients so the “cooking” (modeling and DAX) is predictable.
When to use Power Query vs. DAX: Use Power Query for deterministic row/column shaping that should be identical for every report consumer (e.g., parsing dates, removing duplicates, standardizing categories). Use DAX for calculations that depend on filter context (e.g., YTD, rolling averages). A practical rule: if you can define the transformation without referencing report filters, it likely belongs in Power Query.
Core Principles: Repeatability, Traceability, and Data Types
Repeatability through applied steps: Each query has an Applied Steps list. This is your audit trail. A good practice is to keep steps readable and intentional: rename steps, avoid unnecessary steps, and group logic (for example, do all type changes together).
Traceability with query naming and documentation: Name queries by business meaning (e.g., Sales_Transactions, Dim_Customer) rather than technical source names. Add descriptions in the query properties. This makes it easier to maintain and to explain transformations during stakeholder reviews.
- Listen to the audio with the screen off.
- Earn a certificate upon completion.
- Over 5000 courses for you to explore!

Download the app
Data types are not cosmetic: Correct data types affect sorting, relationships, aggregations, and performance. For example, a “Date” stored as text will break time intelligence later, and numeric values stored as text can silently concatenate instead of sum. Always validate types early and re-check after merges or appended queries, because those operations can introduce type drift.
Step-by-Step: A Practical Power Query Preparation Workflow
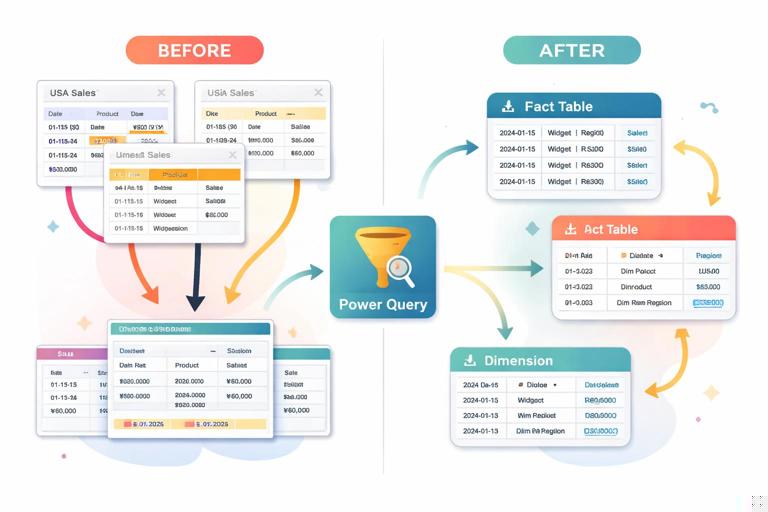
Scenario: You receive monthly sales exports from different regions. Columns are similar but not identical: some files use “Customer Name”, others use “Client”; date formats vary; amounts include currency symbols; and product categories have inconsistent spelling. You want one clean fact table and supporting dimensions.
Step 1: Connect to sources and stage raw queries
How: In Power BI Desktop, use Get Data to connect (Excel, CSV, SharePoint folder, SQL, etc.). If you are combining multiple files, prefer Folder or SharePoint/OneDrive folder connectors so refresh automatically picks up new files.
Best practice: Create a “raw” staging query that does minimal work (often just navigation to the correct table/sheet). Then duplicate it for transformations. This preserves a clean reference point and reduces risk when sources change.
- Name raw queries with a prefix like stg_ (e.g., stg_SalesFiles).
- Disable load for staging queries that you don’t want in the model (right-click query → uncheck Enable load).
Step 2: Promote headers and standardize column names
Promote headers: If the first row contains column names, use Use First Row as Headers. Then immediately check for duplicate or blank headers, which can happen in exports.
Standardize names: Rename columns to a consistent naming convention. For example, choose CustomerName (no spaces) or Customer Name (with spaces), but be consistent across tables. Consistency reduces confusion when building relationships and writing DAX.
Practical mapping example: If some files have “Client” and others “Customer Name”, rename both to “CustomerName”. If you are combining files, do this before appending so the schema aligns.
Step 3: Set and validate data types early
How: Select columns → set type (Date, Whole Number, Decimal Number, Text). For currency, use Decimal Number and handle symbols separately.
Validation checks: Use column profiling tools (View → Column quality/distribution/profile). Look for:
- Errors: often caused by type conversion failures (e.g., “$1,200.50” to number without cleaning).
- Empty values: decide whether to keep, replace, or filter them.
- Unexpected distinct values: e.g., “N/A”, “-”, or “unknown” mixed into numeric columns.
Step 4: Clean text fields (trim, clean, standardize case)
Why: Text inconsistencies create duplicate dimension members (e.g., “Acme”, “ACME”, “Acme ”). That leads to fragmented totals and confusing slicers.
How: Use Transform → Format:
- Trim to remove leading/trailing spaces.
- Clean to remove non-printable characters.
- Capitalize Each Word or Uppercase depending on your standard.
Example: Apply Trim + Clean to CustomerName and ProductName. Then standardize case. If you choose Uppercase for keys, do it consistently across all related tables.
Step 5: Parse and normalize dates
Common issue: One region exports dates as “31/12/2025” (day-first), another as “12/31/2025” (month-first). If Power Query guesses wrong, you’ll get swapped months/days or conversion errors.
How: Use Change Type with locale: Transform → Data Type → Using Locale… and specify the correct locale for the source format. If you have mixed formats in one column, consider splitting logic: detect pattern (e.g., by delimiter positions) and parse accordingly, or standardize upstream if possible.
Normalize to Date: Ensure the final column is a Date type (not Date/Time unless you truly need time). If you need both, keep a DateTime column and add a derived Date column for relationships to a date table.
Step 6: Clean numeric and currency fields
Problem: Amounts like “$1,234.00”, “1.234,00 €”, or “(500)” for negatives.
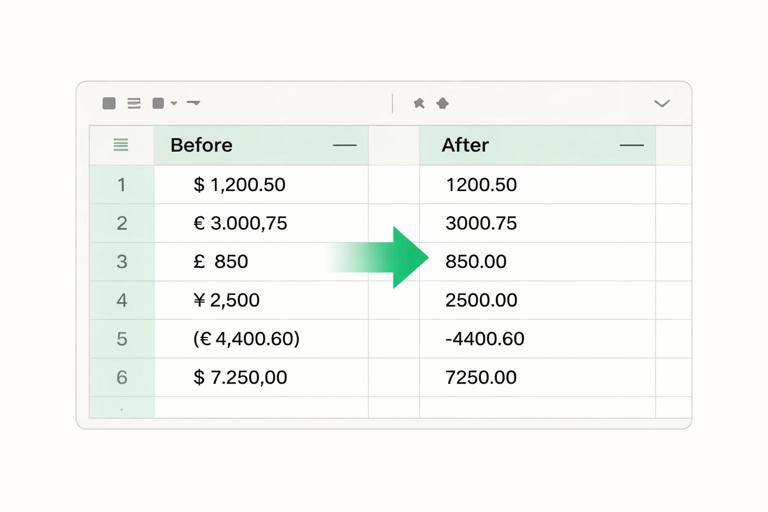
How:
- Replace currency symbols (Transform → Replace Values) or use a custom column to remove non-numeric characters.
- Handle thousands/decimal separators with Using Locale… when changing type.
- Convert parentheses negatives: replace “(” with “-” and remove “)”, then convert to number.
Practical approach: Keep a dedicated step sequence: (1) remove symbols, (2) normalize separators via locale, (3) convert type, (4) check errors. This makes troubleshooting easier when refresh fails.
Step 7: Remove duplicates and enforce keys
Where duplicates hurt: Dimension tables must have unique keys. If CustomerID repeats with different names, relationships become ambiguous and totals may be wrong.
How: For a dimension query, select the key column (e.g., CustomerID) → Remove Rows → Remove Duplicates. Then investigate what was removed: duplicates might indicate real data quality issues (multiple records for same ID) that need business rules.
Business rule example: If duplicates differ only by whitespace/case, fix text cleaning earlier. If duplicates have different addresses, decide whether you need a separate “Customer Address History” table or a “latest address” rule.
Step 8: Split, extract, and derive columns
Why: Source systems often pack multiple attributes into one field (e.g., “Region - Country - City” or “SKU-Color-Size”). Splitting enables better filtering and more meaningful visuals.
How: Use Transform → Split Column by delimiter, by positions, or by transitions (e.g., from lowercase to uppercase). Use Extract for patterns like first characters, last characters, or text between delimiters.
Example: If SKU is “SHOE-BLK-42”, split into ProductLine=SHOE, Color=BLK, Size=42. Set Size to Whole Number after splitting.
Step 9: Append and merge with intent
Append (stack rows): Use when combining monthly files or regional extracts with the same logical schema. Ensure column names and types align first. Missing columns will become nulls; extra columns may appear unexpectedly.
Merge (join tables): Use to enrich a table with attributes from another table (e.g., add RegionName to transactions via RegionCode). Choose join type carefully:
- Left Outer (most common): keep all rows from the main table, bring matches from the lookup.
- Inner: keep only matched rows (useful for data validation but risky for facts).
- Full Outer: useful for reconciliation to find mismatches.
Step-by-step merge example: Select Sales_Transactions → Home → Merge Queries → choose Dim_Product → match on ProductID → Left Outer → expand needed columns (Category, Subcategory) → avoid expanding everything (it bloats the table and can create ambiguity).
Step 10: Build dimensions from facts (when needed)
Common pattern: If you only have a transaction table, you can derive dimensions by referencing it and removing duplicates.
Example: Create Dim_Customer by referencing Sales_Transactions, keep CustomerID and CustomerName, clean text, remove duplicates, then load as a dimension. This reduces manual maintenance and ensures the dimension aligns with the fact data.
Warning: If the fact table contains historical changes (e.g., customer name changes), you must decide whether the dimension should reflect the latest name or preserve history. Power Query can support either approach, but you need a clear rule.
Handling Common Data Quality Issues
Missing values: replace, impute, or flag
Options: Replace nulls with a default (e.g., “Unknown”), fill down for hierarchical exports, or keep nulls and create a data quality flag column.
Practical flag: Add a custom column IsCustomerMissing = if [CustomerID] = null then 1 else 0. This lets you quantify data issues in a quality page without hiding them.
Inconsistent categories: mapping tables
Problem: “Health Care”, “Healthcare”, “HealthCare” appear as separate categories.
Solution: Create a small mapping table (can be entered manually via Enter Data or sourced from a maintained file) with columns: RawValue, StandardValue. Merge it to your fact/dimension and replace RawValue with StandardValue. This is more maintainable than long chains of Replace Values steps.
Outliers and invalid records: filter with transparency
Example: Quantity = -999 or Amount = 0 for completed orders.
Approach: Add a conditional column RecordStatus (Valid/Invalid) using business rules. Filter invalid records out of the main model only if stakeholders agree; otherwise, keep them and exclude via measures. The key is to make the rule explicit and repeatable.
Performance and Maintainability Essentials
Reduce data early (but carefully)
Filter rows early: If you only need the last 24 months, filter in Power Query so you import less data. This improves refresh time and model size. Ensure the filter is stable (e.g., relative to today) and aligns with reporting requirements.
Remove unused columns: Keep only columns needed for relationships, measures, and visuals. Every extra column increases memory usage and can slow down refresh.
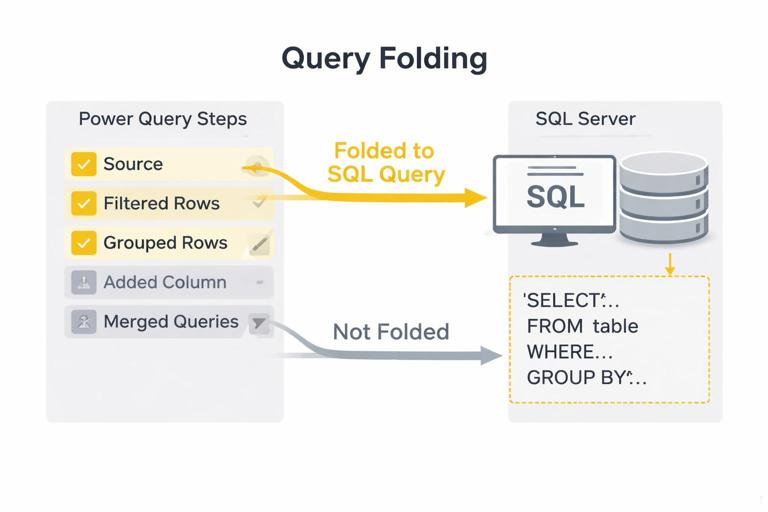
Query folding: push work to the source when possible
Concept: For certain sources (like SQL), Power Query can translate steps into a source query. This is called query folding and can dramatically improve performance.
How to check: Right-click a step → if View Native Query is enabled, folding is likely happening up to that step.
Practical guidance: Do simple filters, column selection, and joins in a way that preserves folding. Some steps (like adding an index in certain contexts or complex custom functions) may break folding. If folding breaks early, consider moving heavy transformations upstream (SQL view) or simplifying steps.
Parameters and functions for scalable ingestion
Parameters: Use parameters for file paths, environment switches (Dev/Prod), or date cutoffs. This reduces hard-coded values and makes the solution portable.
Custom functions: When combining files, Power Query often generates a function to transform a sample file. Review it and keep it clean: ensure it sets types, handles missing columns, and applies consistent renaming so new files don’t break refresh.
Practical Mini-Project: Combine Monthly CSVs into a Clean Fact Table
Objective
Create a single Fact_Sales table from a folder of monthly CSV exports, standardize schema, clean amounts and dates, and enrich with a product mapping.
Step-by-step
1) Connect to Folder: Get Data → Folder → select folder → Combine & Transform. Power Query will create a sample file query and a transformation function.
2) Standardize headers and names in the function: In the transform function, promote headers, rename columns to your standard (e.g., CustomerName, OrderDate, ProductID, Amount), and remove extra columns that vary by month.
3) Clean Amount: Replace “$” and “,” if needed, then change type using locale. Handle parentheses negatives if present.
4) Parse OrderDate with locale: If exports differ by region, add logic: create a custom column that tries one locale, then another, and returns a Date. Validate with error counts.
5) Enforce types: Set ProductID as text (if it can contain leading zeros), Quantity as whole number, Amount as decimal, OrderDate as date.
6) Append automatically: The combined query will stack all files. Confirm that new files added to the folder appear on refresh.
7) Enrich with mapping: Load a Product mapping table (ProductID → Category/Subcategory). Merge into Fact_Sales on ProductID (Left Outer). Expand only Category/Subcategory.
8) Data quality checks: Add columns: IsAmountError, IsDateError, IsProductMissing (based on nulls after merge). Use these later for a data quality view or to filter invalid rows.
Reading and Editing M Code (Without Becoming a Developer)
Why look at M: You don’t need to write M from scratch to benefit from it. Reading it helps you spot redundant steps, understand why a refresh fails, and copy patterns across queries.
Where to find it: In Power Query Editor, Home → Advanced Editor. You’ll see a let…in structure with named steps.
Practical tips:
- Rename steps to meaningful names; it improves readability in M.
- Keep type changes together near the end of shaping (but before load), and re-check after merges.
- Avoid repeated renames; do one consolidated rename step when possible.
let Source = Csv.Document(File.Contents(Path),[Delimiter=",", Encoding=65001, QuoteStyle=QuoteStyle.Csv]), PromotedHeaders = Table.PromoteHeaders(Source, [PromoteAllScalars=true]), Renamed = Table.RenameColumns(PromotedHeaders,{{"Client","CustomerName"},{"Order Date","OrderDate"}}), CleanAmount = Table.TransformColumns(Renamed,{{"Amount", each Text.Replace(Text.Replace(_,"$",""),",",""), type text}}), Typed = Table.TransformColumnTypes(CleanAmount,{{"OrderDate", type date},{"Quantity", Int64.Type},{"Amount", type number}}) in TypedCommon Pitfalls and How to Avoid Them
Relying on auto-detected types
Auto-detection can change when new data arrives. Explicitly set types, especially for IDs, dates, and currency. If an ID sometimes looks numeric, Power Query may convert it to number and drop leading zeros—treat IDs as text unless you are certain they are numeric measures.
Transforming after load instead of before
If you clean categories or parse dates in the model layer (or manually in visuals), you create inconsistencies and make refresh behavior unpredictable. Prefer Power Query for standardization so the model receives a single version of truth.
Expanding too many columns after merges
Expanding everything from a lookup table increases model size and can create duplicate attributes. Expand only what you need for slicing, grouping, or calculations.
Ignoring refresh errors until the last minute
Use column quality indicators and periodically refresh while building transformations. If you wait until the end, it becomes harder to identify which step introduced errors.