Why a workflow matters: choosing methods is a product decision
In practice, teams rarely fail because they do not know any causal methods. They fail because they pick a method before they have clarified operational constraints, data realities, and the decision they must support. A workflow forces you to make the “method choice” the last step, not the first. It also creates a shared checklist across product, analytics, engineering, and stakeholders: what information is needed, what can be assumed, what can be measured, and what tradeoffs are acceptable.
This chapter provides a step-by-step workflow to choose an appropriate causal approach for a business question. It is designed for real environments where you may have partial control over assignment, imperfect data, multiple launches, and time pressure. The goal is not to re-teach individual methods, but to help you select among them (or combine them) in a consistent, auditable way.
Step 0: Write the decision memo first (before the method)
Start with a one-page decision memo that will later be attached to your analysis. This memo is the anchor that prevents “analysis drift.” Include the following fields:
- Decision to be made: what action will change depending on the result (ship, rollback, target, price, allocate budget).
- Time horizon: when the decision must be made and how long effects matter (days vs quarters).
- Risk tolerance: what is the cost of a false positive vs false negative (e.g., revenue loss, user harm, compliance risk).
- Primary estimand: the causal quantity you need (e.g., average effect among eligible users, effect among compliers, effect on treated units).
- Operational constraints: what you can randomize, what you cannot, what is already rolling out, what is logged.
- Success criteria: thresholds for action (e.g., “ship if effect > +0.5% with high confidence and no guardrail regression”).
Practical tip: if you cannot fill in “what action changes,” you are not ready to choose a causal approach. You are still in exploration mode.
Step 1: Classify the intervention and the assignment mechanism
Method choice depends heavily on how the intervention is assigned. Classify the situation using three questions:
- Listen to the audio with the screen off.
- Earn a certificate upon completion.
- Over 5000 courses for you to explore!

Download the app
- Can you control assignment? Full control (randomize), partial control (encouragement, phased rollout), or no control (policy already happened).
- Is assignment at the same unit as measurement? User-level, account-level, store-level, region-level, time-level. Mismatches create interference and aggregation issues.
- Is adoption/compliance perfect? If some units do not receive the treatment they are assigned, you may need designs that handle noncompliance.
Output of Step 1 should be a short label like: “We can randomize at account level, but adoption is imperfect,” or “Policy changed at a known date for one region; no randomization possible.” This label narrows the feasible set of approaches.
Step 2: Inventory data readiness and measurement quality
Before choosing a causal approach, verify that the data can support it. Create a data readiness checklist:
- Unit identifiers: stable IDs for the unit of assignment and outcome measurement.
- Timestamps: event times, exposure times, and outcome windows that allow correct ordering.
- Exposure logging: whether you can measure who was actually exposed, not just eligible.
- Outcome definitions: consistent, not subject to instrumentation changes during the study.
- Covariates: pre-treatment features available at baseline (for adjustment, balance checks, segmentation).
- Missingness patterns: whether missing outcomes correlate with treatment or time.
- Interference risk: whether one unit’s treatment affects another unit’s outcome (network effects, marketplace dynamics).
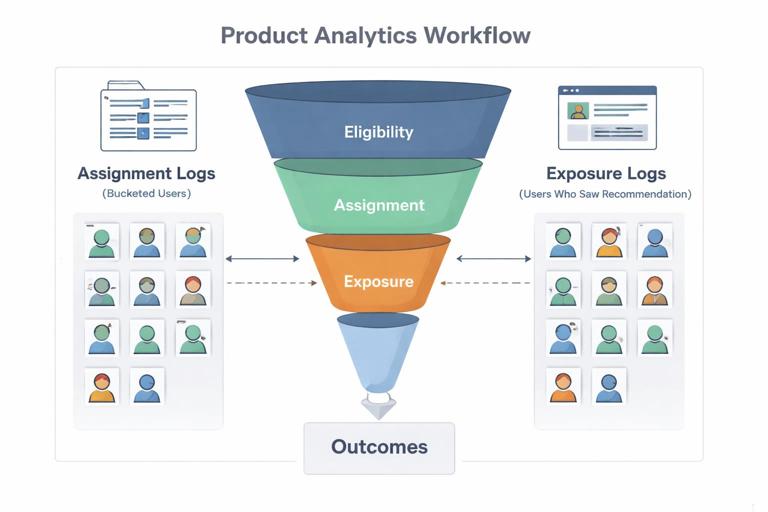
Practical example: if you are evaluating a new recommendation algorithm, you may have assignment logs (who was bucketed) but not exposure logs (who actually saw the module). That distinction determines whether you can estimate an “assignment effect” (intention-to-treat) versus an “exposure effect” (treatment-on-the-treated) and which approach is credible.
Step 3: Decide the minimum credible design given constraints
At this point, choose the simplest design that is credible under your constraints. Use the following decision ladder, moving down only if the rung above is not feasible:
- Rung A: Randomized experiment (if you can randomize and measure outcomes reliably).
- Rung B: Quasi-experiment with a strong assignment rule (if there is a cutoff, a rollout schedule, or an external driver that creates plausibly exogenous variation).
- Rung C: Observational adjustment (if you must rely on measured covariates and modeling assumptions).
The key is to treat this as a “minimum credible design” choice, not a “best statistical technique” choice. A sophisticated model cannot rescue a weak design.
Step 4: Map the workflow to common business scenarios
Use the scenario-to-approach mapping below as a practical shortcut. The goal is to quickly identify candidate approaches, then validate assumptions in later steps.
Scenario 1: You can randomize, but rollout must be gradual
- Candidate approaches: cluster randomization, phased experiments, switchback designs (for time-based assignment), geo experiments (for region-level).
- When to use: operational constraints prevent full simultaneous rollout; interference suggests grouping units.
- Key checks: contamination between groups, stable measurement during rollout, sufficient clusters/time blocks.
Scenario 2: You cannot randomize, but there is a sharp rule or threshold
- Candidate approaches: threshold-based designs where eligibility changes at a cutoff.
- When to use: credit limits, risk scores, eligibility thresholds, service-level rules.
- Key checks: no manipulation around the threshold, continuity of covariates, correct bandwidth choice.
Scenario 3: A policy or feature launched at a known time for some units
- Candidate approaches: before/after with a comparison group, panel-based approaches, synthetic controls for a small number of treated units.
- When to use: region-specific launch, partner-specific contract change, operational change applied to one site.
- Key checks: pre-trend similarity, spillovers, concurrent changes, stable composition.
Scenario 4: Adoption is voluntary or compliance is imperfect
- Candidate approaches: encouragement designs, compliance-aware estimands, designs that separate assignment from uptake.
- When to use: opt-in programs, sales enablement tools, user settings toggles.
- Key checks: clear definition of encouragement, monotonicity plausibility, measurement of uptake.
Scenario 5: No clear quasi-experimental variation; only observational data
- Candidate approaches: covariate adjustment, matching/weighting, doubly robust estimators, sensitivity analysis.
- When to use: historical comparisons, marketing channel attribution without experiments, self-selected feature usage.
- Key checks: overlap/common support, covariate balance, robustness to unmeasured confounding.
Step 5: Choose the estimand that matches the business action
Even with the same design, different estimands can lead to different decisions. Select the estimand explicitly based on how the decision will be executed:
- Effect of assignment (policy effect): relevant when you will assign the policy broadly, regardless of uptake. Common in product rollouts where not everyone engages.
- Effect of exposure/usage: relevant when you can drive or enforce exposure (e.g., mandatory UI change) or when you plan to invest in increasing adoption.
- Effect among eligible units: relevant when only a subset can receive the intervention (e.g., only new users, only certain regions).
- Effect on a constrained resource: relevant when the intervention changes capacity utilization (support tickets, delivery times). You may need an estimand per unit of capacity.
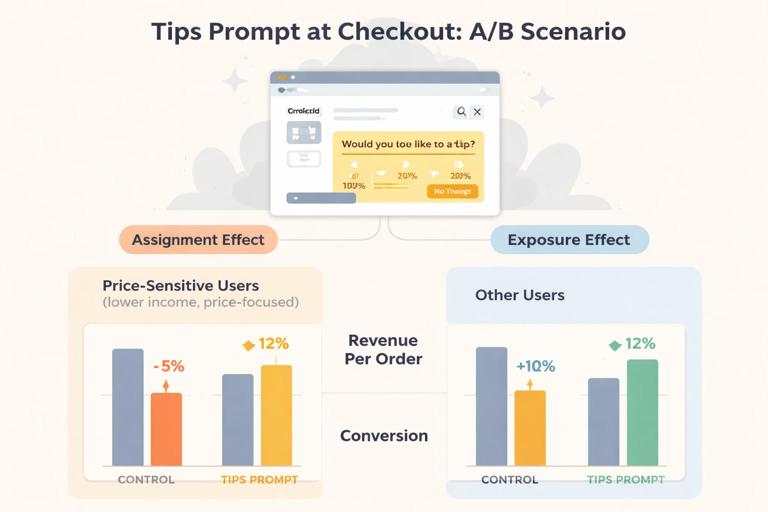
Practical example: a new “tips” prompt in checkout might have a positive effect on revenue per order among exposed users, but if it reduces conversion for price-sensitive users, the overall effect of assigning it to everyone could be negative. If the business action is “turn on for all,” you need the assignment effect; if the action is “target to a segment,” you need segment-specific assignment effects.
Step 6: Validate assumptions with falsification and diagnostic tests
After you have candidate approaches, you must pressure-test the assumptions that make them credible. Build a standard diagnostic suite. The exact tests depend on the approach, but the workflow is consistent: define what would be true if the design is valid, then try to break it.
General diagnostics (apply broadly)
- Placebo outcomes: outcomes that should not be affected (e.g., pre-treatment behavior, unrelated metrics). Significant “effects” here indicate bias.
- Placebo periods: pretend the intervention happened earlier; you should not see an effect.
- Covariate balance: check whether pre-treatment covariates differ across groups in ways that suggest selection.
- Negative controls: variables that share confounding structure but are not causally affected by treatment.
- Sensitivity analysis: quantify how strong an unmeasured confounder would need to be to overturn the result.
Practical example: falsification checklist for a phased rollout
- Compare pre-rollout trends in the outcome across early vs late rollout cohorts.
- Check whether early cohorts differ systematically in baseline covariates (size, engagement, region).
- Run a placebo analysis using a metric that should not change (e.g., profile edits) to detect logging or selection artifacts.
Step 7: Decide the analysis strategy: simple first, then robust
Once the design is selected, choose an analysis strategy that is transparent and resilient. A useful workflow is “simple first, then robust”:
- Primary analysis: the simplest estimator aligned with the design and estimand, with minimal modeling. This is what you will defend to stakeholders.
- Robustness analyses: alternative specifications, alternative windows, alternative covariate sets, trimming/outlier rules, and alternative estimators that should agree directionally if the result is real.
- Heterogeneity checks: pre-specified segments tied to business actions (not fishing). Use them to inform targeting decisions.
Practical example: if you have an observational study with weighting, your primary analysis might be a weighted difference in means with clear diagnostics; robustness might include a doubly robust estimator, alternative propensity models, and trimming extreme weights.
Step 8: Plan for operationalization: from estimate to decision rule
A causal estimate is not yet a decision. Convert the result into an operational rule that accounts for uncertainty, constraints, and monitoring.
Decision rule template
- Ship/scale condition: “Scale to 100% if estimated effect on primary metric exceeds X and guardrails do not degrade beyond Y.”
- Targeting condition: “Enable only for segments where estimated effect is positive and above threshold, with minimum segment size.”
- Rollback condition: “Rollback if guardrail metric crosses threshold or if monitoring detects drift.”
- Monitoring plan: which metrics, what cadence, what alert thresholds, who is on call.
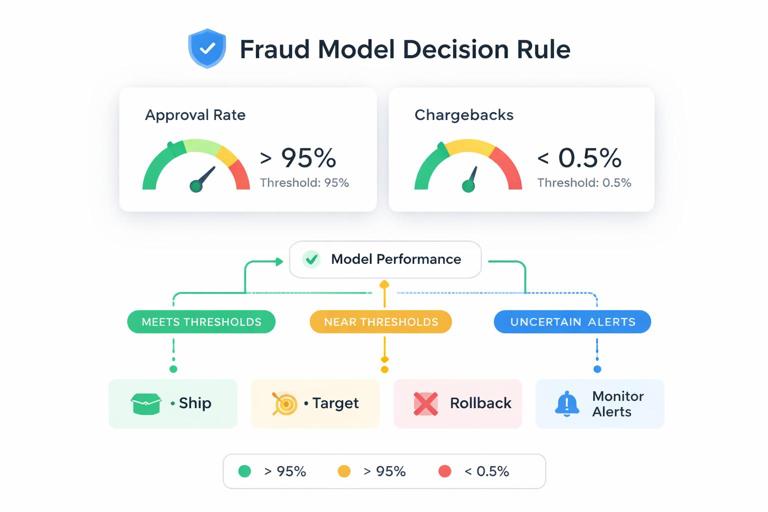
Practical example: for a new fraud model, you might accept a small decrease in approval rate if chargebacks drop materially. Your decision rule should encode that tradeoff explicitly, rather than leaving it to interpretation after the fact.
Step 9: Use a method selection matrix (a repeatable rubric)
To make the workflow repeatable across teams, use a rubric that scores candidate approaches on feasibility and credibility. Below is a lightweight matrix you can adapt.
Candidate approach scoring (1=poor, 5=excellent) Feasibility Credibility Time-to-answer Stakeholder clarity Total Notes Randomized experiment 4 5 3 5 17 Needs engineering support Phased/cluster experiment 3 4 3 4 14 Watch interference Threshold-based design 2 4 4 3 13 Requires clean cutoff Panel with comparison group 5 3 5 4 17 Needs strong diagnostics Observational adjustment (weighting/modeling) 5 2 5 3 15 Requires sensitivity analysisHow to use it:
- List 2–4 plausible approaches given Step 1–3.
- Score quickly with the team; disagreements reveal hidden assumptions.
- Pick the highest total that meets your minimum credibility bar, not necessarily the maximum score.
Step 10: Worked workflow example (end-to-end)
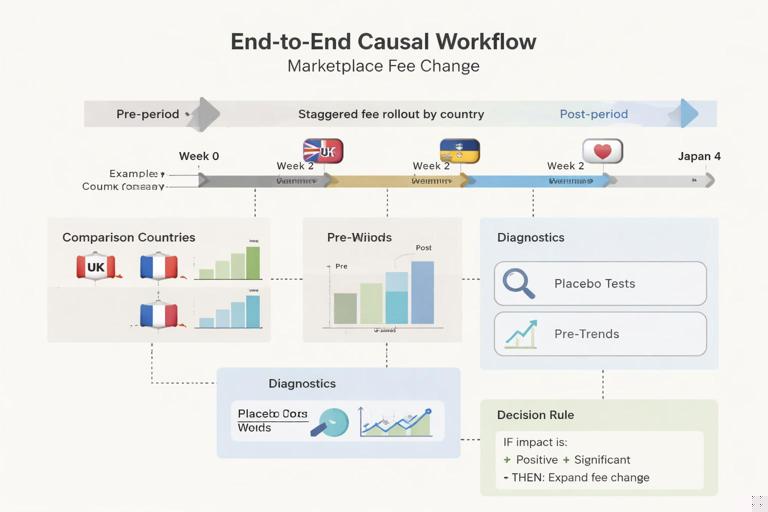
Scenario: A marketplace platform introduces a new seller fee structure for “premium sellers.” Leadership wants to know whether the change increases net revenue without harming buyer conversion. You cannot randomize because the fee change is contractual, but it will be applied first to one country, then later to others.
0) Decision memo
- Decision: expand fee change to additional countries or revise.
- Time horizon: 4 weeks post-change for initial decision; 12 weeks for longer-run monitoring.
- Risk tolerance: avoid buyer conversion drop > 0.3% absolute.
- Estimand: effect of adopting the new fee policy at the country level on net revenue and conversion.
1) Intervention and assignment
- No randomization; assignment is by country and time (staggered rollout).
- Unit: country-day aggregates plus seller-level outcomes for mechanism checks.
2) Data readiness
- Country-level metrics available daily; seller eligibility stable; logging consistent across countries.
- Need to verify that currency conversion and tax handling did not change simultaneously.
3) Minimum credible design
- Candidate: panel-based approach using untreated countries as comparisons; potentially synthetic control for the first treated country if it is unique.
4) Scenario mapping
- Matches “policy launched at a known time for some units.”
5) Estimand choice
- Policy effect at country level (assignment effect), because the action is to expand policy to other countries.
6) Assumption validation
- Check pre-period trends: treated country vs donor pool of similar countries.
- Placebo period: pretend the change happened 30 days earlier; estimate should be near zero.
- Placebo outcome: metric unrelated to fees (e.g., app crash rate) should not shift.
- Spillover check: ensure cross-border buyers are not shifting demand in ways that contaminate controls.
7) Analysis strategy
- Primary: transparent panel comparison with fixed effects and clearly defined pre/post windows.
- Robustness: synthetic control; alternative donor pools; exclude holiday weeks; alternative outcome definitions (gross vs net revenue).
8) Operationalization
- Decision rule: expand if net revenue increases and conversion does not breach guardrail; otherwise revise fee schedule or add buyer incentives.
- Monitoring: weekly dashboard by country; alerts on conversion and seller churn.
This example illustrates the workflow’s intent: you did not start by naming a method. You started by clarifying the decision, then selected the minimum credible design consistent with constraints, then built diagnostics and a decision rule.
Common workflow failure modes (and how to prevent them)
Failure mode: “Method shopping” after seeing results
Teams sometimes try multiple approaches and present the one that supports a preferred narrative. Prevent this by pre-registering (internally) the primary design, estimand, and decision rule in the decision memo, and labeling all other analyses as robustness checks.
Failure mode: Choosing a design that answers a different question
A frequent mismatch is estimating the effect among users who adopted a feature when the business action is to assign it broadly. Prevent this by explicitly writing the estimand and tying it to the rollout plan.
Failure mode: Ignoring interference and unit-of-analysis mismatch
If treatment is assigned at region level but outcomes are measured at user level, naive analysis can overstate precision and misattribute spillovers. Prevent this by aligning the unit of assignment and inference, or using designs that account for clustering and spillovers.
Failure mode: Treating diagnostics as optional
Diagnostics are not “nice to have” in quasi-experiments and observational studies; they are part of the design. Prevent this by making the diagnostic suite a required deliverable alongside the estimate.
A compact checklist you can reuse
- Decision memo completed (action, horizon, risk, estimand, constraints).
- Assignment mechanism classified (control, unit, compliance).
- Data readiness verified (IDs, timestamps, exposure, outcomes, covariates).
- Minimum credible design selected (ladder A/B/C).
- Assumptions documented and mapped to diagnostics.
- Primary analysis and robustness plan specified.
- Decision rule and monitoring plan defined.
- Results packaged with: estimate, uncertainty, diagnostics, and operational recommendation.