What makes a “case study” useful in decision intelligence
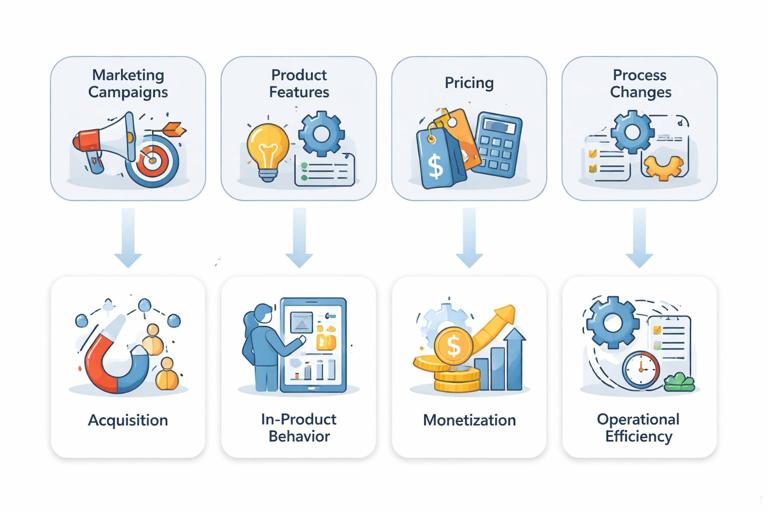
Case studies are not just success stories; they are reusable decision patterns. In decision intelligence with causal inference, a good case study shows how a team moved from a business decision (what to do) to a credible estimate of impact (what happens if we do it), and then to an operational choice (roll out, iterate, stop, or target). This chapter focuses on four common business arenas—marketing campaigns, product features, pricing, and process changes—because they cover most real-world decisions: acquiring customers, changing behavior in-product, monetizing, and improving operations.
Each case study below is structured around: (1) the decision context and what could go wrong if you rely on correlation, (2) the data and measurement plan, (3) the causal strategy and implementation steps, and (4) how to translate results into action. The goal is to give you templates you can adapt, not to re-teach the underlying causal methods.
Case study 1: Marketing campaign effectiveness (incrementality, not attribution)
Scenario
A subscription app runs a multi-channel campaign (paid social, search, influencer) and sees sign-ups rise 18% month-over-month. The marketing dashboard attributes most conversions to paid social last-click. Finance asks: “If we increase spend by 30%, how many incremental subscribers do we get?” The key word is incremental: what would have happened without the campaign.
Common failure mode
Attribution reports can over-credit channels that capture demand rather than create it (e.g., retargeting, branded search). Seasonality, competitor moves, and product updates can also inflate apparent lift. The risk is scaling spend that mostly shifts credit across channels rather than creating new customers.
Measurement plan
- Primary outcome: incremental paid subscribers within 14 days of first exposure (or first eligible day).
- Secondary outcomes: trial starts, revenue at 30/60 days, churn, customer support contacts (guardrail).
- Unit of analysis: user or household; for some channels, geography is more practical.
- Exposure definition: eligible audience vs. actually served impressions; track reach and frequency.
- Time window: pre-period for baseline, campaign period, and a short post-period to capture delayed conversions.
Practical step-by-step: geo-based incrementality test
When user-level randomization is hard (walled gardens, cross-device exposure), geo experiments are a robust alternative.
- Listen to the audio with the screen off.
- Earn a certificate upon completion.
- Over 5000 courses for you to explore!

Download the app
- Step 1: Choose geos and ensure stability. Pick regions with sufficient volume and stable tracking. Exclude geos with known anomalies (recent outages, major local events).
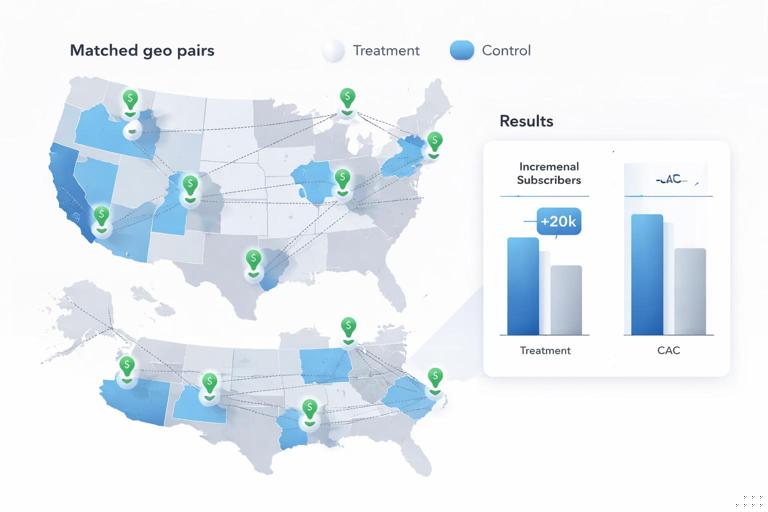
- Step 2: Build matched geo pairs. Pair geos with similar pre-campaign trends in sign-ups and revenue. Matching on pre-period outcomes reduces noise and improves comparability.
- Step 3: Assign treatment and control at the geo level. Increase spend (or enable the campaign) in treatment geos; hold out or reduce spend in control geos. Keep other marketing levers as constant as possible.
- Step 4: Lock the operational plan. Define budget levels, pacing rules, and what happens if a geo under-delivers impressions. Document exceptions before launch.
- Step 5: Validate exposure separation. Confirm that treatment geos actually received higher impressions and that spillover is limited (e.g., users traveling across regions). If spillover is likely, use larger regions or adjust interpretation.
- Step 6: Estimate incremental lift. Compare outcomes between treatment and control geos during the campaign, adjusting for pre-period differences (e.g., using a pre/post comparison at the geo level). Report lift in absolute terms (incremental subscribers) and efficiency (incremental CAC).
- Step 7: Diagnose channel mix effects. If multiple channels changed, decompose by running separate geo tests or staggered rollouts per channel. Otherwise, treat the result as “bundle incrementality.”
How to turn results into a decision
Suppose the test shows +6% incremental subscribers with a 30% spend increase, but CAC rises 25% and 60-day retention is flat. The decision might be: keep spend but reallocate to higher-intent segments or cap frequency. If lift is concentrated in a subset of geos (e.g., urban areas), that suggests targeting rather than blanket scaling.
Operationally, marketing leaders often need a “budget response curve.” You can run multiple tests at different spend levels (or use a stepped design across geos) to estimate diminishing returns. The key is to treat the curve as causal: each point should come from a credible incremental comparison, not from historical spend vs. sales correlations.
Case study 2: Product feature launch (behavior change with adoption and learning curves)
Scenario
A B2B SaaS product introduces an “AI summary” feature in the workflow. Product believes it will reduce time-to-complete tasks and increase retention. Sales wants it enabled by default for all accounts. Support worries it may increase confusion and tickets.
Common failure mode
Early adopters are not representative: power users try new features first and already have higher retention. If you compare adopters vs. non-adopters, you may conclude the feature “causes” retention when it is actually selection. Another risk is measuring too soon: users may need time to learn, and initial friction can reverse later.
Measurement plan
- Primary outcomes: task completion time, weekly active teams, retention at 30/90 days.
- Guardrails: error rate, support tickets per active account, latency, opt-out rate.
- Adoption metrics: exposure (feature available), activation (first use), sustained use (uses per week).
- Segmentation: account size, industry, baseline usage intensity, admin vs. end-user roles.
Practical step-by-step: staged rollout with clear “intent-to-treat” reporting
- Step 1: Define the rollout unit. For B2B, randomize at the account or workspace level to avoid cross-user contamination inside a company.
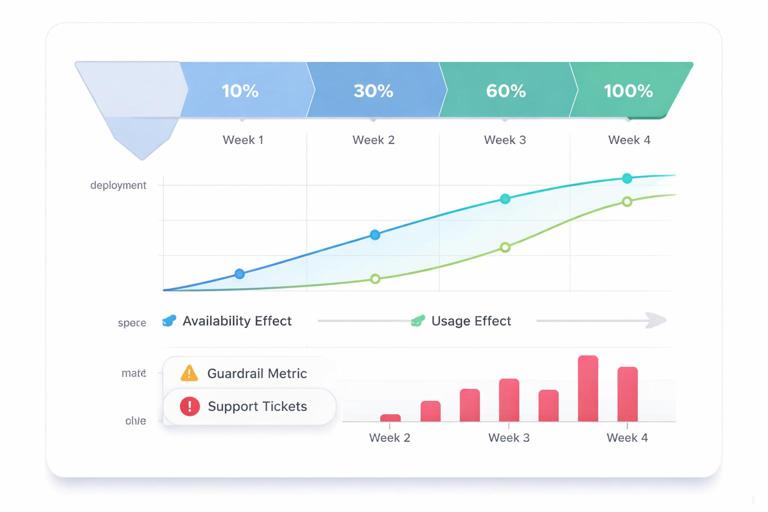
- Step 2: Create rollout stages. Example: 10% of accounts in week 1, 30% in week 2, 60% in week 3, 100% in week 4. Keep a stable holdout if you want longer measurement.
- Step 3: Instrument feature exposure and usage. Log “feature available,” “feature used,” and key workflow events. Ensure logs are consistent across web and mobile clients.
- Step 4: Pre-register decision thresholds. For example: ship to 100% if task time decreases by at least 3% and support tickets do not increase by more than 2%.
- Step 5: Analyze two effects separately. (a) Availability effect (what happens when the feature is enabled for an account, regardless of whether users adopt), and (b) usage effect (what happens among those who actually use it). The first is most relevant for the ship decision; the second informs onboarding and nudges.
- Step 6: Check for learning curves. Plot outcomes over time since enablement. A feature that looks neutral in week 1 may become positive by week 4. Conversely, novelty spikes can fade.
- Step 7: Decide on default settings and education. If availability improves retention but increases tickets, you might ship with a guided tutorial, better tooltips, or enable only for admins first.
Example interpretation
Imagine the rollout shows: task time -5% (good), retention +1% (small), tickets +8% (bad) concentrated in small accounts. A reasonable decision is to ship to mid/large accounts while improving onboarding for small accounts, then re-test. The case study lesson is that “feature impact” is often a portfolio of effects: productivity, satisfaction, and operational load. Decision intelligence means choosing the best trade-off, not chasing a single metric.
Case study 3: Pricing change (revenue, conversion, and long-term customer quality)
Scenario
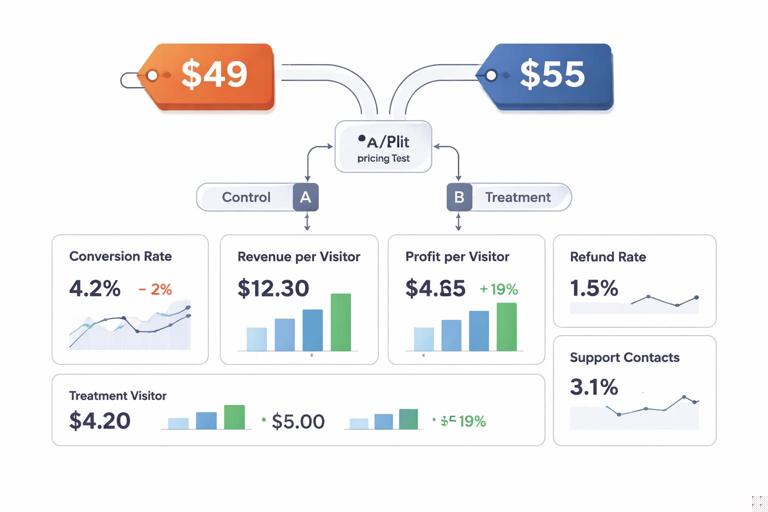
An e-commerce company considers increasing the price of a best-selling bundle from $49 to $55. The merchandising team argues that demand is inelastic; the growth team worries about conversion drop and higher refund rates. The CFO wants a forecast of revenue impact and margin.
Common failure mode
Before/after comparisons are misleading because demand fluctuates with seasonality, promotions, and competitor pricing. Another trap is focusing only on immediate revenue: higher prices can change customer mix, affecting repeat purchase and support costs.
Measurement plan
- Primary outcomes: revenue per visitor (RPV), conversion rate, gross margin.
- Secondary outcomes: average order value, units per transaction, refunds/returns, repeat purchase at 60/120 days.
- Customer quality: customer lifetime value proxy (e.g., 90-day net revenue), support contacts, fraud rate.
- Constraints: legal/compliance requirements, price parity rules, marketplace policies.
Practical step-by-step: price test with guardrails and “holdout integrity”
- Step 1: Choose the randomization level. Often user-level is feasible on owned channels; for marketplaces, you may need geo or time-based variation. Ensure customers do not see multiple prices in a confusing way (e.g., across devices) if that violates policy.
- Step 2: Define price variants and exposure rules. Example: control $49, treatment $55. Decide whether the price is sticky per user (recommended) and for how long.
- Step 3: Set guardrails. For example: do not ship if refunds increase by >1 percentage point or if customer support contacts increase by >5%.
- Step 4: Monitor competitive and promo interference. Freeze other promotions on the tested SKU if possible. If not, log promo exposure and interpret results as “price within current promo environment.”
- Step 5: Estimate short-run and medium-run effects. Short-run: conversion and RPV. Medium-run: repeat purchase and returns. A price increase can look great on day 1 and degrade customer quality later.
- Step 6: Compute decision-ready metrics. Translate effects into incremental profit, not just revenue. Include payment fees, shipping, returns, and support costs.
- Step 7: Plan a rollout strategy. If the price increase works overall but hurts a segment (e.g., first-time buyers), consider targeted discounts, bundles, or a two-tier offer.
Example interpretation
Suppose treatment reduces conversion from 4.0% to 3.6% (-10%) but increases AOV enough that RPV rises 3%, and returns are unchanged. Profit per visitor rises 4%. The decision could be to ship the higher price, but also to invest in messaging (value framing) to mitigate conversion loss. If repeat purchase drops among first-time buyers, you might keep the higher price for returning customers and offer a first-purchase incentive, then validate that the incentive does not erase profit gains.
Case study 4: Process change in operations (speed, quality, and unintended consequences)
Scenario
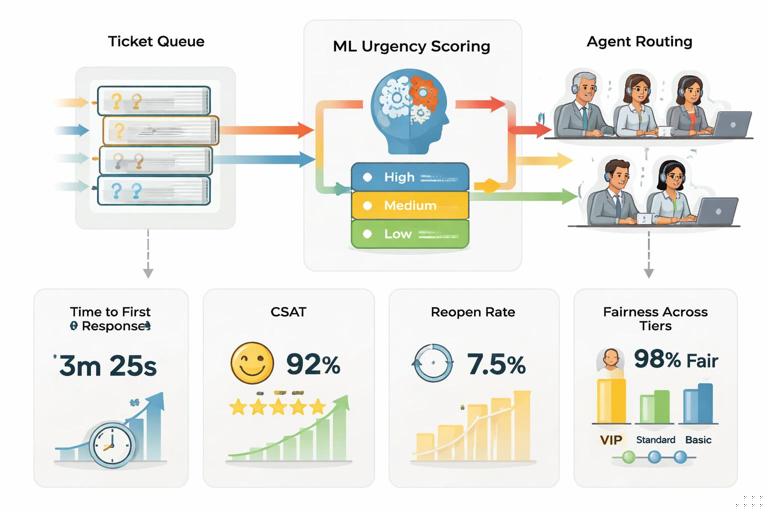
A customer support organization changes its triage process: instead of routing tickets by product area, it routes by urgency score from an ML model. The goal is to reduce time-to-first-response and improve customer satisfaction. Leaders worry that agents may “game” the system or that low-urgency tickets will be neglected.
Common failure mode
Operational changes often coincide with staffing shifts, new tooling, or seasonal ticket spikes. If you compare metrics before and after the change, you may attribute improvements to the process when they were caused by hiring or lower volume. Another risk is optimizing one metric (speed) while harming another (resolution quality).
Measurement plan
- Primary outcomes: time-to-first-response, time-to-resolution, CSAT.
- Quality metrics: reopen rate, escalation rate, repeat contact within 7 days.
- Fairness/coverage: distribution of response times across customer tiers and issue types.
- Agent outcomes: burnout proxy (after-hours work), schedule adherence, attrition risk.
Practical step-by-step: phased implementation with operational controls
- Step 1: Choose a rollout unit that matches workflow. Options include support teams, queues, or shifts. Avoid mixing routing logic within the same queue if it creates confusion.
- Step 2: Train and standardize. Provide a short playbook for the new routing. In process changes, variation in adherence is a major driver of inconsistent results.
- Step 3: Run a pilot with a stable comparison group. Example: pilot in one region or one product line while another similar group continues with the old process.
- Step 4: Track compliance and exceptions. Log when agents override routing, when tickets are reclassified, and when the urgency score is missing. These are not “noise”; they explain outcomes.
- Step 5: Monitor queue health daily. Watch backlog size, aging tickets, and the tail of response times (p90/p95). Process changes often improve averages while worsening tails.
- Step 6: Evaluate trade-offs explicitly. If time-to-first-response improves but reopen rate rises, you may be pushing quick but incomplete answers. Adjust agent incentives or add a quality checklist.
- Step 7: Decide on scaling and governance. If the ML urgency model is part of the process, set a cadence for recalibration and drift monitoring. Operational processes degrade when the underlying data distribution changes.
Example interpretation
Assume the pilot shows: time-to-first-response improves by 20%, CSAT is flat, reopen rate increases by 3%, and low-tier customers experience longer waits. A decision-intelligent response is not simply “ship or don’t ship.” You might ship with constraints: cap the maximum wait time for any ticket, reserve capacity for low-urgency queues, and add a quality review step for certain categories. The case study lesson is that process changes are multi-objective optimizations; causal impact must be assessed across speed, quality, and equity of service.
Cross-case playbook: how to run and communicate these studies in practice
1) Start from the decision and the “actionable effect”
In all four domains, the most useful effect estimate is the one that changes a decision: budget allocation, default settings, price points, or workflow rules. Before analysis, write the decision memo skeleton: what you will do if the effect is positive, negative, or ambiguous. This prevents “interesting but unusable” results.
2) Use a scorecard, not a single metric
Marketing needs incrementality and CAC; product needs adoption, retention, and support load; pricing needs profit and customer quality; operations needs speed and quality. Build a one-page scorecard with: primary metric, 2–4 guardrails, and 1–2 diagnostic metrics (like reach/frequency, adoption, or backlog tail). This makes trade-offs explicit and reduces debates driven by cherry-picked charts.
3) Treat implementation details as part of the causal question
“Campaign on” is not a single treatment if creative, targeting, and pacing change mid-flight. “Feature enabled” is not the same as “feature used.” “Price increased” can be undermined by coupons and promotions. “New process” may be partially adopted. In each case, log the operational reality and report it alongside outcomes.
4) Plan for heterogeneity as a product requirement
Many decisions should not be global. Marketing lift varies by region and audience; features vary by account maturity; price sensitivity varies by acquisition channel; process changes vary by ticket type. Build segmentation into the analysis plan and define which segments are eligible for differential treatment (e.g., targeted pricing may be restricted by policy).
5) Make the result decision-ready: translate into dollars, capacity, and risk
Executives rarely ship changes because a metric moved; they ship because the business case is clear. Convert effects into: incremental profit, incremental subscribers, hours saved, tickets avoided, or capacity freed. Include uncertainty ranges and operational risks (e.g., “best estimate saves 400 agent-hours/week; plausible range 150–650”).
6) Document what you learned even when the effect is null
A null result can still be valuable if it rules out a costly strategy. For example: a marketing channel that shows no incrementality can be deprioritized; a feature that does not improve retention may still be worth shipping for competitive parity but should not be marketed as a retention lever; a price increase that raises short-run profit but harms repeat purchase suggests a need for better value communication; a process change that improves averages but harms tails indicates where to add constraints.
Example “case study template” you can reuse
Decision: (e.g., increase paid social spend by 30%? enable feature by default? raise price? change routing?)
Treatment definition: what exactly changes operationally
Population/unit: who is affected; randomization or rollout unit
Primary metric: the metric that drives the decision
Guardrails: metrics that must not degrade beyond thresholds
Exposure/compliance: how you verify the treatment actually happened
Time horizon: short-run and medium-run windows
Estimation plan: what comparison will identify impact
Heterogeneity plan: which segments you will check and why
Decision rule: what you will do under positive/negative/uncertain results
Operational follow-ups: logging fixes, onboarding, targeting, governance