Why reusable checklists and templates matter
Experimentation programs fail more often from inconsistent execution and unclear communication than from lack of statistical sophistication. Reusable checklists and templates create a shared operating system: they reduce omissions (like missing eligibility rules or incomplete logging), standardize decisions (like when to stop or roll back), and make results comparable across teams and time. They also speed up onboarding and reduce “reinventing the wheel” for every new test.
In this chapter you will build a practical toolkit: (1) a design checklist to ensure experiments are buildable, measurable, and safe; (2) templates for pre-registration, analysis plans, and decision memos; (3) communication artifacts for stakeholders, including launch announcements and readouts; and (4) lightweight governance patterns that keep templates useful rather than bureaucratic.

Principles for building templates people actually use
1) Optimize for the most common failure modes
Templates should prevent the mistakes that repeatedly cause rework: unclear primary metric, ambiguous population, missing exposure definition, lack of owner for instrumentation, unclear decision rule, and no plan for edge cases (like partial rollout or delayed effects). If a field does not prevent a real failure, remove it.
2) Separate “must-have” from “nice-to-have”
Use a two-tier structure: a short mandatory checklist (one page) and optional sections for advanced cases. This keeps velocity high while preserving rigor when needed.
3) Make templates executable
Every item should be answerable with concrete text, a link, or a number. Avoid vague prompts like “consider risks.” Replace them with “list top 3 risks, each with a monitoring metric and rollback threshold.”
- Listen to the audio with the screen off.
- Earn a certificate upon completion.
- Over 5000 courses for you to explore!

Download the app
4) Embed ownership and timestamps
Most confusion comes from “who decided what, when.” Every template should include: owner, approver(s), date, and version. For experiments, include the planned launch date and the planned readout date.
5) Design for reuse and comparability
Use consistent naming: experiment ID, treatment name, primary metric name, analysis window, and unit of assignment. Consistency enables dashboards, meta-analysis, and portfolio reporting later.
The Experiment Design Checklist (one-page)
This checklist is meant to be completed before launch. It is intentionally short and operational. Teams can paste it into a ticket, doc, or PR description.
EXPERIMENT DESIGN CHECKLIST (PRE-LAUNCH) — v1.0 [ ] required fields completeBasics
- Experiment ID and short name:
- Owner (DRI) and backup:
- Stakeholders (product, eng, data, legal/compliance if needed):
- Planned launch date / planned readout date:
Decision and scope
- Decision to be made (what will change if we win/lose/inconclusive?):
- Ship criteria (what outcome qualifies as “win”?):
- Stop/rollback criteria (what outcome triggers rollback?):
- Scope of rollout (%, regions, platforms):
Population and assignment
- Unit of assignment (e.g., user, account, session):
- Eligibility rules (who is included/excluded):
- Randomization/assignment mechanism link (service/config):
- Expected sample flow (approx users/day eligible):
Treatment and exposure
- Treatment variants (control + each variant):
- Exposure definition (what counts as “treated”):
- Expected adoption/compliance issues (if any):
Metrics
- Primary metric (single, named, with exact computation link):
- Secondary metrics (max 3):
- Guardrails (max 3) with thresholds:
- Metric windows (e.g., same-day, 7-day, 28-day):
Instrumentation and data quality
- Event/logging changes required? (yes/no). If yes: link to PR/ticket:
- Experiment assignment logged? (yes/no) Where:
- Exposure logged? (yes/no) Where:
- Metric data sources (tables/dashboards):
- QA plan: A/A or dry run, sample event validation steps:
Analysis readiness
- Planned analysis method (link to analysis plan doc):
- Planned segmentation (if any) and why:
- Handling of bots/fraud/internal traffic:
- Handling of missing data / late events:
Operational safety
- Monitoring dashboard link:
- On-call/rollback owner during launch window:
- Known dependencies (billing, email, inventory, latency):
Step-by-step: how to use the checklist in practice
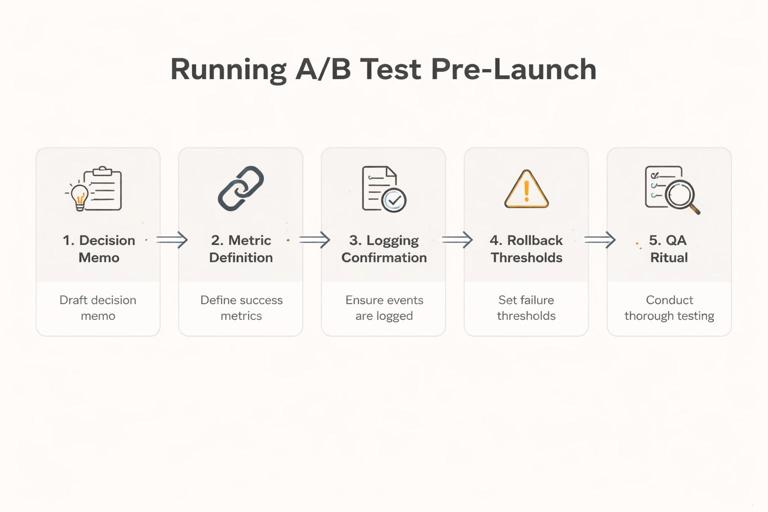
Step 1: Start with the decision memo header
Before you fill in details, write the “decision to be made” and “ship criteria.” This prevents metric sprawl and keeps the experiment tied to an action. Example: “Decide whether to default new users into annual billing. Ship if net revenue per new user increases by at least $X with no more than Y% increase in refund rate.”
Step 2: Lock the primary metric definition with a link
Teams often agree on a metric name but not its computation. Your template should force a link to a metric definition (SQL, semantic layer, or metric registry). If the metric is new, the template should require a “definition snippet” and an owner for validation.
Step 3: Confirm exposure and assignment logging
Many experiments become unreadable because assignment is not logged consistently, or exposure is inferred indirectly. The checklist should require explicit “where is assignment stored” and “where is exposure stored.” If exposure is not logged, document the proxy and its limitations.
Step 4: Pre-commit to stop/rollback thresholds
Operationally, teams need a clear rule for when to stop. The template should include guardrails with thresholds and who has authority to roll back. This reduces debate during incidents.
Step 5: Run a pre-launch QA ritual
Make QA a repeatable mini-process: validate assignment splits, validate event counts, validate metric pipelines. The template should list the exact checks (e.g., “verify assignment ratio within 49–51% after 1 hour” or “verify exposure event fires on iOS and Android”).
Template: Experiment Pre-Registration (lightweight)
A pre-registration template is not about bureaucracy; it is about freezing key choices before seeing results. Keep it short and focused on decisions that are easy to “accidentally” change later (primary metric, analysis window, exclusions, and decision rule).
EXPERIMENT PRE-REGISTRATION — v1.0- Experiment ID / name:
- Owner / reviewers:
- Business decision:
- Primary metric (exact definition + link):
- Guardrails (definition + thresholds):
- Analysis window(s):
- Eligibility and exclusions (incl. internal traffic, bots):
- Planned duration (calendar dates) OR stopping rule:
- Planned segments to report (and rationale):
- Data sources (tables/dashboards):
- Known risks and mitigations (top 3):
- Decision rule (what constitutes win/lose/inconclusive):
- Sign-offs (product/eng/data):
Practical example: pre-registration snippet
Primary metric: “Checkout completion rate = completed_checkouts / initiated_checkouts, measured per eligible user within 7 days of first exposure. Definition: link to metric registry entry.”
Guardrail: “Payment error rate must not increase by more than 0.2 percentage points; rollback if exceeded for 4 consecutive hours post-launch.”
Template: Analysis Plan (operational, not academic)
The analysis plan template should answer: what dataset will be used, what transformations are required, what comparisons will be made, and what outputs will be produced. It should also specify how you will handle common data issues (late events, duplicates, multiple devices) in a consistent way.
ANALYSIS PLAN — v1.0Data extraction
- Experiment assignment table and key fields:
- Exposure table and key fields:
- Outcome/metric tables and key fields:
- Join keys and time alignment rules (e.g., exposure timestamp):
Dataset construction
- Unit of analysis (must match assignment unit):
- Handling multiple exposures (first exposure vs any exposure):
- Deduplication rules:
- Late-arriving data cutoff:
Primary analysis output
- Effect estimate format (absolute diff, relative lift):
- Uncertainty reporting format (intervals, standard errors):
- Planned covariate adjustments (if any) and why:
Secondary outputs
- Secondary metrics table (same structure as primary):
- Guardrail monitoring summary:
Segment reporting
- Segments (exact definitions):
- Minimum segment size for reporting:
- How segments will be labeled in the readout:
Quality checks
- Assignment balance checks:
- Sanity checks on metric distributions:
- SRM/ratio checks (if applicable):
Deliverables
- Readout deck/doc link:
- Results table format (CSV/BI dashboard):
- Code repo/notebook link:
Template: Launch Announcement (for stakeholders)
Many experiments create confusion because stakeholders learn about them after users do. A launch announcement template makes the rollout transparent and reduces surprise escalations. Keep it short and operational.
EXPERIMENT LAUNCH ANNOUNCEMENT — v1.0- What is launching (one sentence):
- Who is affected (population + % rollout):
- When it starts and expected duration:
- Primary metric and guardrails (names only, no deep stats):
- Monitoring links (dashboard + logs):
- Rollback owner and how to page them:
- Known user-facing changes (support implications):
Practical example: launch announcement
What: “New onboarding screen with simplified plan selection.” Who: “New web signups, 10% initially.” When: “Tue 10:00–18:00 local time ramp to 10%, hold for 7 days.” Monitor: “Signup completion, payment errors, support tickets.”
Template: Results Readout (one-page decision memo)
A results readout should be decision-first: what happened, how confident are we, what do we do next. It should also be comparable across experiments so leaders can scan many readouts quickly.
EXPERIMENT READOUT (ONE-PAGER) — v1.0Header
- Experiment ID / name:
- Owner / date:
- Status: shipped / not shipped / iterate / follow-up needed
Decision
- Recommended action:
- Rationale (2–3 bullets):
- Risks/unknowns that remain:
What was tested
- Control vs treatment summary:
- Population and timeframe:
- Any deviations from plan (and why):
Primary metric result
- Control value:
- Treatment value:
- Effect size (absolute and/or relative):
- Uncertainty summary (intervals):
Guardrails
- Guardrail metric 1: result vs threshold:
- Guardrail metric 2: result vs threshold:
Secondary metrics (brief)
- Metric: effect summary:
Segments (only pre-registered or clearly labeled exploratory)
- Segment A:
- Segment B:
Operational notes
- Data quality issues encountered:
- Implementation learnings (performance, UX, support):
Next steps
- If shipping: rollout plan and monitoring:
- If not shipping: follow-up experiment or alternative:
How to keep readouts honest and useful
- Separate pre-planned vs exploratory: In the segments section, label anything not pre-registered as exploratory and avoid using it as the sole reason to ship.
- Include baseline values: Stakeholders need to know whether an effect is meaningful in absolute terms (e.g., +0.2% on a 1% baseline vs on a 50% baseline).
- Document deviations: If the rollout paused, if eligibility changed, or if a logging patch shipped mid-test, record it. Future readers will otherwise misinterpret results.
Template: Experiment Portfolio Log (for program management)
As the number of experiments grows, leaders need a portfolio view: what is running, what decisions are pending, and what cumulative impact is expected. A portfolio log template standardizes metadata so you can filter and report across teams.
EXPERIMENT PORTFOLIO LOG — v1.0 (one row per experiment)- Experiment ID
- Team / area
- Owner
- Status (planned/running/readout/shipped/archived)
- Start date / end date
- Primary metric
- Decision (ship/no/iterate)
- Estimated impact (if shipped) + method of estimation
- Links (pre-reg, analysis, readout, dashboard, code)
- Notes (data issues, learnings)
Template: Stakeholder FAQ (preempt common questions)
Stakeholders often ask the same questions in every readout. A reusable FAQ section reduces meeting time and increases trust. You can append this to the readout or keep it as a standard slide.
- What exactly changed for users? (Include screenshots or a short description.)
- Who was included/excluded? (Eligibility rules.)
- How long did we run and why? (Dates and stopping rule.)
- Any known data quality issues? (Logging, outages, pipeline delays.)
- Any operational impacts? (Latency, support tickets, refunds, inventory.)
- What happens next? (Rollout plan or follow-up test.)
Reusable “decision rules” library (copy/paste patterns)
Teams waste time debating decision criteria from scratch. Create a small library of decision rules that can be reused and adapted. Each rule should specify: primary metric threshold, guardrail constraints, and what to do when results are inconclusive.
Pattern A: Ship if meaningful lift and guardrails safe
- Ship if primary metric improves by at least M (absolute or relative) and all guardrails remain within thresholds.
- If primary metric is positive but below M, classify as “inconclusive” and decide between iteration vs deprioritization based on effort and strategic value.
- If any guardrail breaches threshold, do not ship; investigate root cause and consider redesign.
Pattern B: Two-stage rollout with operational gate
- Stage 1 (small %): proceed only if no operational guardrails breach within first T hours (errors, latency, support tickets).
- Stage 2 (larger %): proceed only if primary metric is directionally positive and guardrails remain safe.
- Final ship decision at end of analysis window.
Pattern C: Cost-saving experiments with quality floor
- Ship if cost metric decreases by at least C while quality metric does not decrease beyond Q.
- Require a monitoring plan post-ship because cost optimizations can degrade slowly over time (e.g., supplier quality, user trust).
Templates for communication across audiences
1) Executive summary (30 seconds)
Executives want the decision, magnitude, and risk. Use a strict format to avoid over-explaining.
- Decision: Ship / Don’t ship / Iterate
- Impact: +X on primary metric (baseline Y), guardrails OK/not OK
- Confidence: high/medium/low (with one reason)
- Risk: top risk and mitigation
2) Product/engineering summary (implementation and next steps)
Product and engineering need what to build next and what to monitor.
- What to change in code/config
- Rollout plan and monitoring dashboards
- Edge cases discovered (platform differences, performance)
- Follow-up instrumentation tasks
3) Analytics summary (reproducibility)
Analysts need reproducibility and comparability.
- Dataset construction notes and links
- Exact metric definitions and windows
- Any deviations from pre-registration
- Code/notebook link and query snapshots
Governance: keeping templates lightweight but enforceable
Define “gates” where templates are required
Instead of requiring full documentation for every idea, require it at specific gates:
- Gate 1 (before engineering work): a short intake template (decision, primary metric, owner, rough scope).
- Gate 2 (before launch): the one-page design checklist + pre-registration.
- Gate 3 (before shipping broadly): the one-page readout + rollout plan.
Use templates as defaults, not constraints
Allow exceptions, but require that exceptions are explicit. Add a field: “Which template fields are not applicable and why?” This prevents silent omissions.
Version your templates
When you improve a template, bump the version and keep old versions accessible. This avoids confusion when comparing older experiments to newer ones.
Building a shared repository of examples
Templates become far more effective when paired with real examples. Maintain a small library of “gold standard” documents: one excellent pre-registration, one excellent readout, one excellent launch announcement. Link these examples directly inside the templates as “See example.”
Suggested repository structure
- /templates: checklist, pre-reg, analysis plan, readout, launch announcement
- /examples: 3–5 curated examples with annotations
- /metrics: links or docs for metric definitions
- /dashboards: standard monitoring dashboards
- /playbooks: QA steps, rollout steps, incident response for experiments
Advanced add-ons (optional sections)
Template add-on: Experiment QA checklist (instrumentation-focused)
If your organization frequently struggles with data quality, add a separate QA checklist that engineering and analytics both sign.
- Assignment event fires for all platforms
- Exposure event fires only when user truly sees the feature
- Events include experiment ID, variant, timestamp, unit ID
- Dashboards update within expected latency
- Backfill plan if pipeline delays occur
Template add-on: Rollout plan after a win
Shipping is not a single moment; it is a controlled expansion. A rollout plan template reduces post-experiment risk.
- Rollout stages (10% → 25% → 50% → 100%) and dates
- Monitoring metrics and alert thresholds per stage
- Owner and on-call coverage
- Communication plan (support, sales, ops)
Template add-on: Experiment “learning capture”
To avoid repeating failed ideas, capture learnings in a structured way.
- What we learned about users/customers
- What we learned about the system (performance, constraints)
- What we would do differently next time
- Reusable assets created (metrics, dashboards, components)