Capstone Goal: A Real Marketplace or Learning Platform API
This capstone focuses on turning a GraphQL API into a production-ready product surface for either (a) a marketplace (buyers, sellers, listings, orders, payouts) or (b) a learning platform (courses, lessons, enrollments, progress, certificates). The emphasis here is not on re-teaching schema design, resolvers, pagination, security, or observability patterns already covered earlier, but on how to assemble them into a cohesive system, define measurable performance targets, run benchmarks that reflect real usage, and apply a production readiness checklist that catches the non-obvious failure modes.
You will leave this chapter with: a reference domain model for both product types, a set of representative operations (queries and mutations) to benchmark, a benchmark plan with datasets and load profiles, and a checklist that you can apply before launch and during ongoing operations.
Domain Blueprint: Choose Marketplace or Learning Platform
Marketplace: Core Entities and Workflows
A marketplace API typically needs to support discovery, conversion, and fulfillment. A practical minimal domain includes: User (buyer/seller), Store or SellerProfile, Listing, Inventory, Cart, Order, PaymentIntent, Shipment, Review, and Dispute. The workflows you should explicitly support are: browse/search listings, view listing detail, add to cart, checkout, order tracking, seller listing management, and post-purchase review.
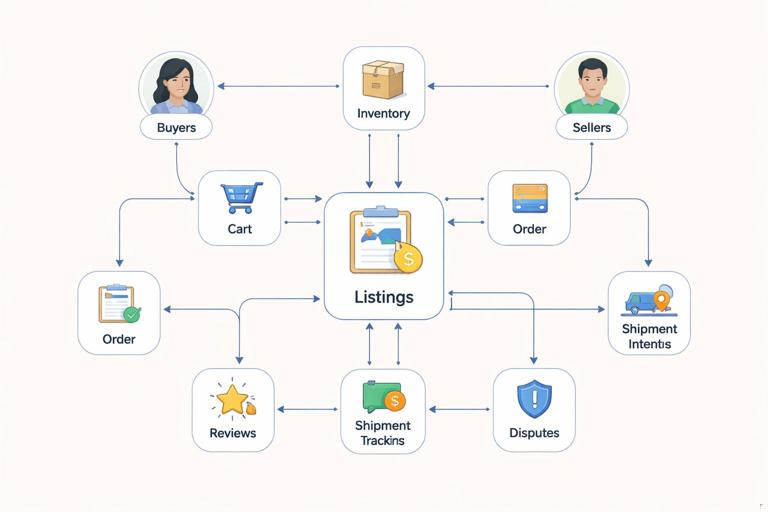
In GraphQL terms, the capstone is about ensuring these workflows are fast, safe, and observable under load, and that they remain stable as you add features like promotions, bundles, or multi-currency pricing.
Learning Platform: Core Entities and Workflows
A learning platform API typically needs to support content delivery, enrollment, progress tracking, and credentialing. A practical minimal domain includes: User, Course, Module, Lesson, Enrollment, ProgressEvent, Quiz, Submission, Grade, Certificate, and InstructorProfile. The workflows you should explicitly support are: course catalog browsing, course detail, enrollment, lesson playback/content fetch, progress updates, quiz submission, and certificate retrieval.
- Listen to the audio with the screen off.
- Earn a certificate upon completion.
- Over 5000 courses for you to explore!

Download the app
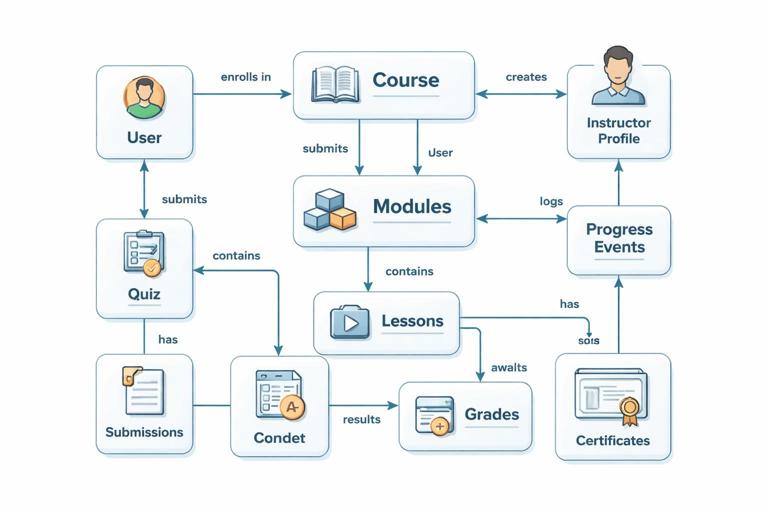
In GraphQL terms, the capstone is about ensuring that high-frequency operations (lesson fetch and progress updates) remain low-latency, while catalog and analytics queries remain bounded and cost-controlled.
Representative Operations to Benchmark (Your “Golden Paths”)
Benchmarks are only meaningful if they reflect real client behavior. Define a small set of “golden path” operations that cover 80% of traffic and 80% of revenue or engagement. Keep them stable over time so you can compare releases.
Marketplace Golden Path Operations
Listing search results: query listings with filters/sort and return minimal card fields (title, price, thumbnail, rating).
Listing detail: query a listing with images, seller summary, shipping estimates, and a small set of reviews.
Cart view: query cart items with pricing breakdown and availability checks.
Checkout mutation: create order + payment intent, validate inventory, compute totals.
Order status: query order timeline and shipment tracking.
Seller dashboard: query seller’s listings with inventory and recent orders summary.
Learning Platform Golden Path Operations
Course catalog: query courses with filters/sort and return card fields (title, instructor, duration, rating).
Course detail: query course outline (modules/lessons) plus enrollment state for the viewer.
Lesson fetch: query lesson content metadata and signed media URL (or playback token).
Progress update mutation: record progress events (time watched, completion flags).
Quiz submission mutation: submit answers, compute score, return feedback.
My learning: query active enrollments with progress summaries.
Define “Heavy” and “Light” Shapes for Each Operation
For each golden path, define two shapes: a light shape (typical mobile list view) and a heavy shape (detail view with nested fields). The goal is to ensure your cost controls and caching strategies behave correctly when clients request more data. You are not trying to forbid heavy queries; you are trying to ensure they are predictable and safe.
# Example: Listing detail (heavy) - marketplace (illustrative shape only) query ListingDetailHeavy($id: ID!) { listing(id: $id) { id title description price { amount currency } images { url width height } seller { id displayName rating } shippingEstimate { minDays maxDays cost { amount currency } } reviews(first: 10) { edges { node { id rating comment author { id displayName } } } } } }Benchmark Plan: From Dataset to Load Profile
Step 1: Define Performance Targets (SLOs) Per Operation
Pick targets per operation rather than a single global number. A lesson fetch might need p95 under 150 ms at the API layer, while seller dashboard might tolerate p95 under 400 ms because it is less frequent and more complex. Define at least: p50, p95, p99 latency; error rate; and saturation signals (CPU, memory, DB connections, queue depth).
Latency: p95 and p99 are the primary indicators for user experience under load.
Error budget: define a max error rate (for example 0.1% for reads, 0.5% for writes) and classify which errors count (timeouts, 5xx, upstream failures).
Throughput: requests per second per operation, not just total RPS.
Step 2: Build a Realistic Dataset
Benchmarks on tiny datasets lie. Create a dataset that matches your expected scale and distribution. For a marketplace: tens of thousands of listings, skewed popularity (a small percentage of listings get most views), and a realistic number of reviews per listing. For a learning platform: thousands of courses, each with modules and lessons, and a large number of progress events per active user.
Also model “hot keys”: a few popular courses or listings that receive disproportionate traffic. Hot keys are where caching helps and where stampedes can happen if you do not protect upstreams.
Step 3: Create a Traffic Mix That Matches Reality
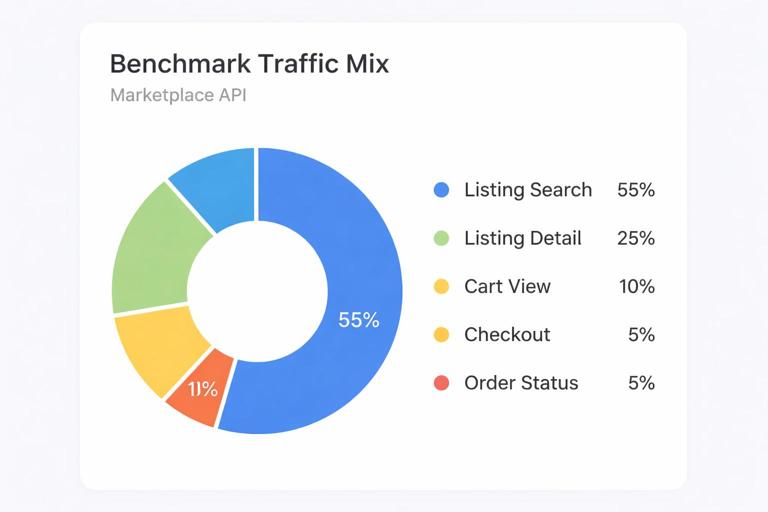
Define a traffic mix by operation. Example marketplace mix: 55% listing search, 25% listing detail, 10% cart view, 5% checkout, 5% order status. Example learning mix: 40% lesson fetch, 25% course detail, 20% my learning, 10% progress update, 5% quiz submission. Use separate mixes for peak hours and off-peak.
Include authenticated and anonymous traffic if your product supports both. Include a small percentage of “heavy” shapes to ensure they remain safe and do not dominate resources.
Step 4: Choose Benchmark Types
Microbenchmarks: isolate one operation against a controlled environment to measure raw resolver and data-source performance.
Load tests: apply the traffic mix at increasing RPS until you hit SLO violations or resource saturation.
Soak tests: run at steady load for hours to detect memory leaks, cache growth issues, and connection pool exhaustion.
Spike tests: sudden traffic jumps to validate autoscaling, warm caches, and upstream protection.
Step 5: Make Benchmarks Deterministic and Comparable
To compare releases, keep these constant: dataset snapshot, operation documents (ideally persisted), traffic mix, and environment sizing. Record the exact build version, configuration, and dependency versions. If you change any of these, treat it as a new baseline.
Step-by-Step: Running a Practical Benchmark Cycle
Step 1: Freeze the Operation Documents
Export the exact GraphQL documents for each golden path and store them in version control. If you use persisted operations, reference them by ID in the benchmark harness. This prevents accidental query drift and ensures you are testing what clients actually run.
Step 2: Prepare the Environment
Use an environment that resembles production: same database engine and version, similar indexes, similar cache topology, and realistic network boundaries. If you cannot match production size, keep ratios consistent (for example, DB connections per API instance) and document the differences.
Step 3: Warm Up and Prime Caches Intentionally
Run a warm-up phase to avoid measuring cold-start artifacts unless cold-start is itself a requirement. For example, prime the most popular listing detail and course detail queries, then begin the measured phase. Also run a separate cold-cache benchmark to understand worst-case behavior.
Step 4: Execute the Load Profile in Stages
Increase load in steps (for example 25%, 50%, 75%, 100%, 125% of expected peak) and hold each stage long enough to stabilize. At each stage, record p95/p99 latency per operation, error rate, and resource utilization. Stop when you exceed SLOs or hit saturation signals.
Step 5: Attribute Latency to Layers
When an operation violates SLOs, you need to know whether the time is spent in GraphQL execution, data-source calls, cache misses, or downstream services. Use your tracing and metrics to break down: time in parsing/validation, time in resolvers, time per upstream call, and time waiting on pools (DB, HTTP, thread pools).
Step 6: Apply Fixes and Re-baseline
For each bottleneck, apply one change at a time and re-run the same benchmark stage. Examples of changes include: adding an index, adjusting connection pool sizes, tuning cache TTLs, reducing over-fetch in a heavy shape, or adding a precomputed aggregate for a dashboard field. Keep a changelog of benchmark results so you can see regressions early.
Benchmark Metrics That Matter for GraphQL APIs
Operation-Level Metrics
Latency percentiles per operation: p50/p95/p99 for each golden path.
Resolver timing distribution: identify the top slow fields and their call counts.
Upstream call counts per request: detect accidental fan-out and hidden N+1 patterns.
Cache hit ratio per layer: response cache, field cache, and data-source cache hit rates.
Resource and Saturation Metrics
CPU and event loop lag (or thread pool utilization): indicates compute saturation.
Memory and GC behavior: indicates leaks or high allocation rates from large response objects.
DB connection pool wait time: indicates pool sizing issues or slow queries.
Queue depth and timeouts: indicates backpressure problems.
Correctness Metrics Under Load
Performance without correctness is not readiness. Track business invariants during benchmarks: orders created must match payments initiated; inventory must not go negative; progress events must be idempotent; quiz submissions must not double-grade. Include validation checks in the benchmark harness that sample responses and verify invariants.
Production Readiness Checklist (GraphQL-Specific)
API Surface and Client Compatibility
Golden paths documented: the operations you benchmark are the operations you support operationally (alerts, dashboards, runbooks).
Persisted operations policy: define which clients must use persisted operations and how you roll out new ones.
Deprecation workflow: every deprecated field has an owner, a replacement, and a removal timeline.
Response size limits: enforce maximum response size to prevent accidental megabyte payloads.
Performance and Capacity
Per-operation SLOs: defined and monitored; alerts tied to p95/p99 and error rate.
Capacity model: expected peak RPS, headroom target (for example 2x), and scaling plan.
Hot key protection: cache stampede mitigation (request coalescing, stale-while-revalidate, or jittered TTLs).
Backpressure behavior: when downstreams slow, the API fails fast with safe errors rather than cascading timeouts.
Data Consistency and Idempotency
Idempotency keys for write operations: checkout, progress updates, quiz submissions, and refunds should be safe to retry.
Transactional boundaries documented: what is atomic (order creation) vs eventually consistent (search index updates).
Outbox or event publishing guarantees: if you publish events (order created, enrollment created), ensure at-least-once with deduplication.
Security and Abuse Resistance (Operational Checks)
Abuse playbooks: what to do when you see scraping, credential stuffing, or query cost abuse.
Tenant isolation checks: for multi-tenant marketplaces (multiple stores) or B2B learning (organizations), verify isolation at the field level and in downstream queries.
Secrets and key rotation: payment provider keys, signing keys for media URLs, webhook secrets.
Observability and Incident Response
Operation name hygiene: every request has a stable operation name or persisted ID for grouping.
Dashboards per golden path: latency, errors, cache hit rate, and upstream dependency health.
Runbooks: “p99 latency spike on listing detail”, “DB pool exhaustion”, “payment provider degradation”, “media signing service errors”.
Sampling strategy: traces sampled in a way that preserves slow requests and errors.
Production Readiness Checklist (Marketplace-Specific)
Checkout and Payments
Payment state machine: explicit states (initiated, authorized, captured, failed, refunded) and transitions validated server-side.
Webhook handling: idempotent processing, signature verification, replay protection, and dead-letter strategy.
Price integrity: totals computed server-side; client-provided prices treated as hints only.
Inventory and Fulfillment
Inventory reservation strategy: define when stock is reserved (at cart, at checkout, at payment authorization) and how it expires.
Oversell prevention: concurrency controls and reconciliation jobs.
Shipment tracking integration: timeouts and fallbacks if carrier APIs degrade.
Production Readiness Checklist (Learning Platform-Specific)
Content Delivery and Media
Signed URL/token issuance: short TTLs, audience restrictions, and revocation strategy for compromised tokens.
CDN strategy: ensure lesson content and thumbnails are served via CDN; GraphQL should not become a media proxy.
Offline and resume behavior: progress events should tolerate intermittent connectivity and out-of-order delivery.
Progress, Grading, and Certificates
Progress event schema stability: events are append-only; derived progress is computed reliably.
Anti-cheat considerations: rate limits and anomaly detection for progress spikes or repeated quiz attempts.
Certificate issuance rules: deterministic criteria and audit trail for compliance.
Practical Example: Benchmark Harness Structure
A benchmark harness should generate load, record results, and validate correctness. Keep it separate from the API codebase so it can run against staging and production-like environments. The harness typically has: a scenario definition (traffic mix), an identity pool (users with different roles), a dataset map (popular listing IDs/course IDs), and validators (invariants).
// Pseudocode structure for a benchmark scenario const scenario = { durationSeconds: 900, stages: [ { rps: 50, holdSeconds: 180 }, { rps: 100, holdSeconds: 180 }, { rps: 150, holdSeconds: 180 }, { rps: 200, holdSeconds: 180 }, { rps: 250, holdSeconds: 180 } ], mix: [ { op: "ListingSearchLight", weight: 0.55 }, { op: "ListingDetailHeavy", weight: 0.25 }, { op: "CartView", weight: 0.10 }, { op: "Checkout", weight: 0.05 }, { op: "OrderStatus", weight: 0.05 } ], datasets: { hotListingIds: "zipfian", hotUserIds: "zipfian" }, validators: [ "noNegativeInventory", "orderPaymentStateConsistent" ] };Practical Example: Production Readiness Review Meeting Agenda
Before launch, run a structured review that forces evidence-based answers. The goal is to avoid “we think it’s fine” and replace it with benchmark results, dashboards, and runbooks.
Golden paths: show p95/p99 per operation at expected peak and at 2x peak.
Failure drills: demonstrate behavior when the database is slow, when a payment/media provider is down, and when cache is cold.
Correctness under retries: show idempotency for key mutations with simulated timeouts.
Operational readiness: show dashboards, alert thresholds, and on-call runbooks for top incidents.
Rollout plan: canary strategy, rollback criteria, and feature flag coverage for risky changes.
What “Done” Looks Like for This Capstone
You can consider this capstone complete when you can run a repeatable benchmark suite that produces stable baselines, you can explain where time is spent for each golden path, and you can pass the production readiness checklist with concrete evidence: dashboards exist, alerts fire, runbooks are actionable, and the system behaves predictably during spikes and dependency failures.