Why Root-Cause Analysis (RCA) Is Harder in Complex Delivery Failures
Complex delivery failures rarely have a single cause. They emerge from interacting conditions: unclear decision rights, hidden work, brittle dependencies, partial automation, shifting constraints, and feedback delays. Root-cause analysis (RCA) in this context is the disciplined practice of identifying the smallest set of underlying conditions that, if changed, would prevent recurrence. The goal is not to assign blame or produce a perfect narrative; it is to produce actionable, testable causes that lead to effective countermeasures.
In complex work, “the root cause” is often a misleading phrase. You are typically looking for a causal chain (how the failure happened) and a causal network (why the system allowed it). A useful RCA output includes: (1) a clearly bounded failure mode, (2) evidence-backed contributing factors, (3) the mechanisms linking them, and (4) prioritized interventions with owners and verification signals.
Common traps in RCA for delivery failures
- Symptom substitution: treating a visible symptom (missed milestone) as the cause (slow developers) without explaining the mechanism.
- Single-cause bias: forcing one “root” when multiple conditions must align for failure.
- Hindsight certainty: assuming the right choice was obvious, ignoring information available at the time.
- Blame gravity: explanations collapse toward individual error rather than system design (process, incentives, tooling, constraints).
- Unfalsifiable causes: “lack of ownership” or “poor communication” without observable evidence or a measurable change.
How to Choose the Right RCA Method
Different RCA methods answer different questions. Choose based on the nature of the failure and what you need to decide next.
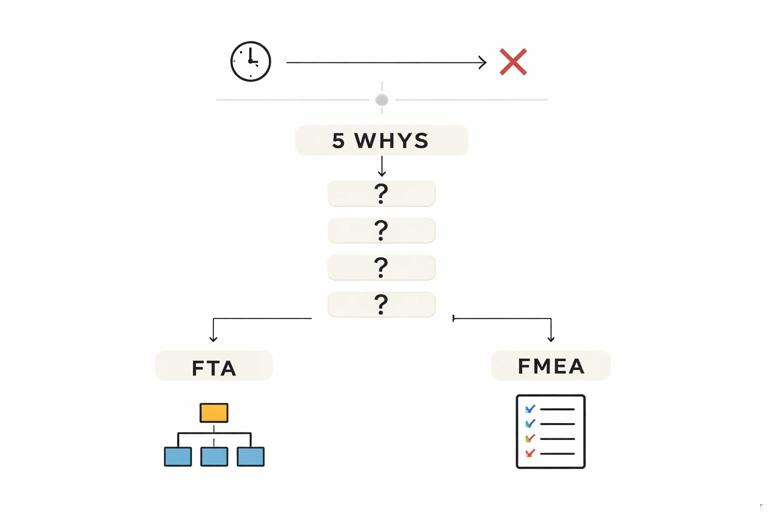
- Need a fast, teachable chain of causality: 5 Whys (with guardrails) or a causal chain.
- Need to map multiple contributing factors and interactions: Fishbone (Ishikawa) plus evidence tags; causal loop diagram for feedback effects.
- Need to analyze a process breakdown with controls: Fault Tree Analysis (FTA) or Bowtie analysis.
- Need to prevent recurrence by hardening the system: FMEA (Failure Modes and Effects Analysis) to prioritize mitigations.
- Need to understand decision-making under uncertainty: Timeline + “information at the time” review (blameless postmortem style).
In practice, you often combine methods: start with a timeline to anchor facts, then use 5 Whys on the most critical failure mode, then validate with FTA or FMEA to ensure you didn’t miss key branches and to prioritize fixes.
Method 1: Timeline Reconstruction (Evidence-First RCA)
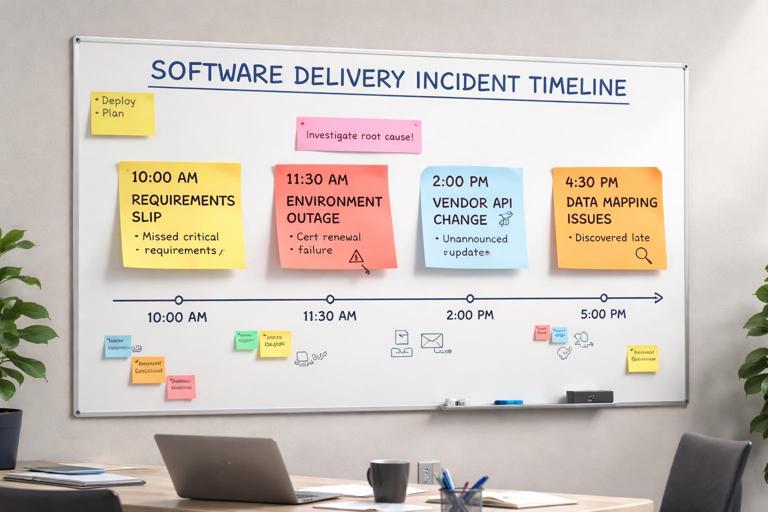
A timeline is the backbone of complex RCA because it separates what happened from what people believe happened. It also reveals delays, handoffs, and decision points that are invisible in summary reports.
- Listen to the audio with the screen off.
- Earn a certificate upon completion.
- Over 5000 courses for you to explore!

Download the app
Step-by-step
- Step 1: Define the failure mode precisely. Example: “Release 24.3 failed in production due to database migration timeout, causing 3 hours of outage and rollback.” Avoid broad statements like “the release went badly.”
- Step 2: Build a time-ordered event log. Include: code freeze, approvals, merges, build start/end, test results, deployment steps, alerts, mitigation actions, rollback, customer impact start/end.
- Step 3: Add decision points and information available at the time. For each decision (e.g., “proceed with deploy”), record what signals were visible (dashboards, test reports, risk notes) and what was missing.
- Step 4: Annotate with evidence links. Tickets, CI logs, monitoring graphs, chat excerpts, incident notes, change requests. Mark each event as “confirmed” or “reported.”
- Step 5: Identify breakpoints. Breakpoints are moments where the path could have changed: a test failure ignored, a risk accepted, a dependency not validated, a rollback delayed.
Practical example
Suppose a program missed a regulatory deadline because integration testing started late. A timeline might show: requirements sign-off slipped by 2 weeks; integration environment was unavailable for 10 days due to certificate renewal; a vendor API version changed; the team discovered incompatible data mappings only after end-to-end tests began. The timeline makes it clear that “testing started late” is a symptom; the causal chain includes environment readiness controls and dependency change management.
Method 2: 5 Whys (With Guardrails for Complex Systems)
5 Whys is useful when you need a quick causal chain, but it can oversimplify complex failures. The guardrails are what make it effective: use evidence, allow branching, and stop at controllable system conditions rather than personal traits.
Step-by-step
- Step 1: Start from a single failure mode. Example: “Sprint 12 delivered only 40% of committed stories.”
- Step 2: Ask “Why?” and answer with observable facts. “Because 6 stories were blocked by unresolved API contract changes.”
- Step 3: For each answer, ask “Why?” again, and allow branches. API contract changes may branch into “vendor changed spec” and “internal service team refactored without notice.”
- Step 4: Stop when you reach a condition you can change with a specific control. Example: “No contract testing and no change notification policy across teams.”
- Step 5: Convert the final causes into countermeasures and verification signals. Countermeasure: “Introduce consumer-driven contract tests in CI for both services.” Verification: “Contract test suite runs on every merge; breaking changes fail build; number of integration defects decreases.”
Example 5 Whys chain (with branching)
- Problem: Production hotfix took 18 hours.
- Why? Build and deploy pipeline required manual approvals from two managers who were offline.
- Why? Approvals were added after a prior incident to “increase control.”
- Why? There was no automated evidence of test coverage and change risk, so control relied on human sign-off.
- Why? CI did not produce a standardized release artifact with test results, security scan, and rollback plan attached.
- Root conditions (actionable): missing automated release evidence; governance designed around availability of specific individuals; lack of risk-based approval rules.
Notice the chain avoids “because the manager didn’t respond” and instead lands on system design: approvals coupled to individuals and lack of automated assurance.
Method 3: Fishbone (Ishikawa) for Multi-Factor Delivery Breakdowns
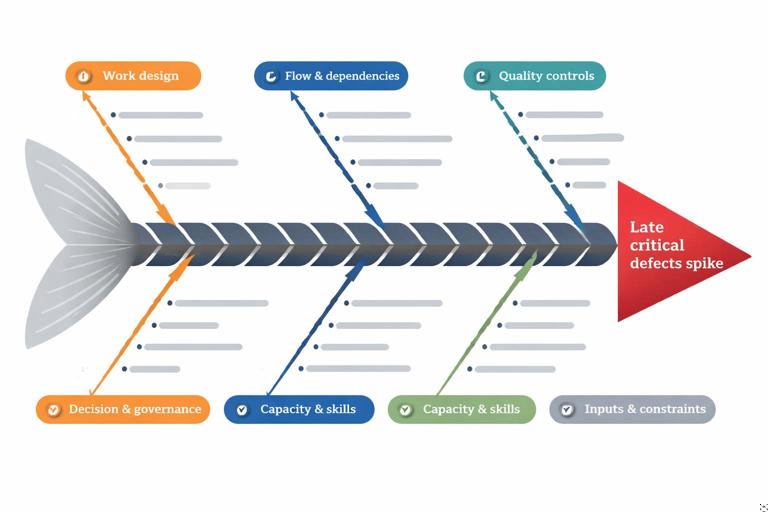
A fishbone diagram helps you explore categories of contributing factors without prematurely choosing a single narrative. For delivery failures, use categories that reflect delivery mechanics rather than generic “people/process/technology.”
Suggested categories for delivery failures
- Work design: story slicing, definition of done, acceptance criteria, hidden work.
- Flow & dependencies: handoffs, external teams, vendor lead times, environment readiness.
- Quality controls: test strategy, automation, code review, release gates.
- Tooling & infrastructure: CI/CD reliability, environment parity, observability.
- Decision & governance: approval paths, change control, escalation rules.
- Capacity & skills: onboarding, specialist bottlenecks, key-person risk.
- Inputs & constraints: regulatory requirements, data availability, procurement constraints.
Step-by-step
- Step 1: Write the failure mode at the “head.” Example: “End-to-end testing found 47 critical defects in final month.”
- Step 2: Brainstorm causes into categories. Encourage breadth; do not debate yet.
- Step 3: Attach evidence to each candidate cause. Mark each as “supported,” “suspected,” or “disproven.”
- Step 4: Identify the few causes with strongest evidence and highest leverage. These become candidates for deeper analysis (FTA/FMEA) and immediate countermeasures.
Practical example
If critical defects spike late, fishbone often reveals a combination: incomplete acceptance criteria (work design), low automation coverage (quality controls), unstable test environment (tooling), and late integration with a dependent service (flow). The fishbone output is not the answer; it is a structured inventory that prevents tunnel vision.
Method 4: Fault Tree Analysis (FTA) for “How Could This Happen?”
Fault Tree Analysis starts with an undesired top event and decomposes it into logical combinations of contributing events using AND/OR logic. It is especially useful when you need to identify missing controls and ensure you did not overlook alternative paths to failure.
When to use FTA in delivery recovery
- Repeated release failures with different surface symptoms
- High-severity incidents where prevention must be demonstrable
- Complex dependency chains (multiple services, vendors, environments)
Step-by-step
- Step 1: Define the top event. Example: “Deployment caused customer checkout failures.”
- Step 2: Identify immediate contributing events. Example: “API returned 500s” OR “frontend served incompatible bundle” OR “database migration locked tables.”
- Step 3: Decompose each branch until you reach basic events. Basic events are concrete and testable: “migration ran without lock timeout,” “no canary,” “no contract test,” “feature flag defaulted on.”
- Step 4: Validate each basic event with evidence. Logs, configs, pipeline records, runbooks.
- Step 5: Identify minimal cut sets. These are smallest combinations of basic events that can produce the top event. They guide where controls will have maximum impact.
- Step 6: Translate into controls. Add gates, tests, monitoring, or procedural checks that break the cut sets.
Mini example (textual)
Top event: Checkout fails after deploy (OR) A) DB migration locks tables (AND) A1) Migration includes full-table rewrite A2) No pre-deploy load test on migration path A3) No lock timeout / no online migration strategy B) API contract mismatch (AND) B1) Backend changed response field name B2) Frontend deployed expecting old field B3) No contract tests / no versioning policyThis structure makes it clear that preventing recurrence is not “be more careful,” but implementing online migration patterns, contract testing, and deployment coordination/versioning.

Method 5: Bowtie Analysis for Controls and Recovery Barriers
Bowtie analysis connects causes to a central event and then to consequences, with barriers on both sides. It is powerful for delivery failures because it distinguishes prevention controls (left side) from mitigation controls (right side). Many troubled projects over-invest in detection and under-invest in prevention, or vice versa.
Step-by-step
- Step 1: Define the central event. Example: “Release deployed with breaking change.”
- Step 2: List threats (causes) on the left. Examples: “unreviewed config change,” “incomplete regression suite,” “dependency version drift.”
- Step 3: List consequences on the right. Examples: “outage,” “data corruption,” “SLA breach,” “rollback with downtime.”
- Step 4: Add barriers. Prevention barriers: code review rules, config-as-code, contract tests, canary deploy. Mitigation barriers: automated rollback, feature flags, runbooks, on-call escalation.
- Step 5: Identify barrier weaknesses. Example: canary exists but no meaningful traffic; rollback exists but takes 2 hours due to database state.
Bowtie outputs a control map that is easy to communicate to governance stakeholders because it shows what will prevent recurrence and what will limit impact if prevention fails.
Method 6: FMEA to Prioritize What to Fix First
Failure Modes and Effects Analysis (FMEA) is a prioritization method: list potential failure modes, their effects, and the controls that detect/prevent them. Then score each by severity, occurrence likelihood, and detectability to compute a risk priority number (RPN) or use a simpler ranking if scoring is too heavy.
When FMEA is useful in a rescue context
- You have many plausible causes and limited capacity to fix them all
- You need to justify sequencing of improvements
- You want to move from “analysis” to “engineering the system”
Step-by-step
- Step 1: Define the scope. Example: “Release pipeline from merge to production.”
- Step 2: List failure modes. Examples: “tests flaky,” “artifact not reproducible,” “manual step missed,” “environment drift.”
- Step 3: Define effects and current controls. “Flaky tests” effect: delays, bypassing tests; controls: rerun manually.
- Step 4: Score severity, occurrence, detectability. Use 1–5 or 1–10 scales. Keep scoring consistent and quick.
- Step 5: Prioritize top items and define actions. Actions must change the score drivers: reduce occurrence (automation), reduce severity (feature flags), improve detectability (monitoring).
- Step 6: Assign owners and verification metrics. Example metric: “% of pipeline runs requiring manual rerun” or “mean time to detect regression.”
Practical example (compact table format)
Failure mode: Flaky integration tests Effect: Delays; teams bypass tests Controls: Manual rerun Severity: 4 Occurrence: 5 Detectability: 3 Priority: High Action: Stabilize tests; quarantine flaky tests; add test reliability dashboard Verification: Flake rate <2% for 4 weeksMethod 7: Causal Loop Diagrams for Feedback-Driven Failure Patterns
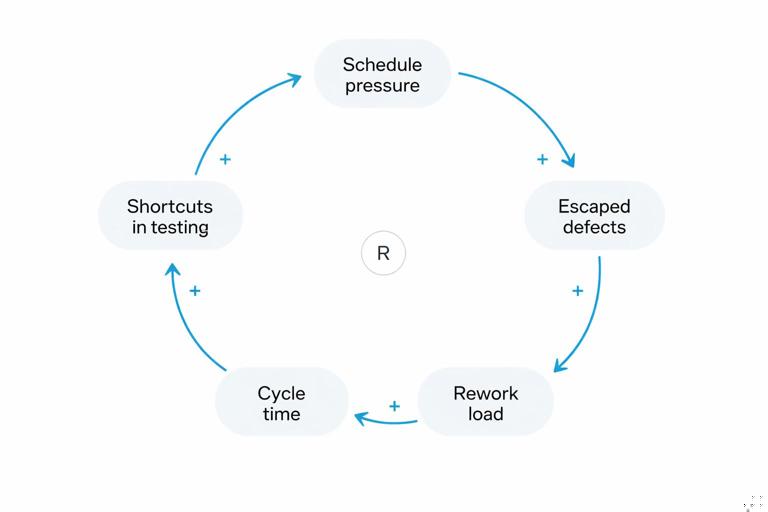
Some delivery failures persist because of reinforcing loops: schedule pressure leads to shortcuts, shortcuts increase defects, defects increase rework, rework increases pressure. Causal loop diagrams (CLDs) help you see why “work harder” interventions fail and where to break the loop.
Step-by-step
- Step 1: Identify key variables. Examples: “work in progress,” “defect rate,” “rework load,” “cycle time,” “schedule pressure.”
- Step 2: Draw causal links with polarity. If A increases B, mark “+”; if A increases and B decreases, mark “-”.
- Step 3: Identify reinforcing and balancing loops. Reinforcing loops amplify; balancing loops stabilize.
- Step 4: Choose intervention points. Example: cap WIP, improve test automation, introduce release trains, reduce batch size.
Example loop (textual)
Schedule pressure (+) -> Shortcuts in testing (+) -> Escaped defects (+) -> Rework load (+) -> Cycle time (+) -> Schedule pressureThis makes it easier to justify interventions like reducing batch size or enforcing quality gates, because they target the loop rather than the symptom.
Turning Findings into Actionable Root Causes (Quality Criteria)
Regardless of method, a “root cause” should meet quality criteria. Use these as a checklist before you socialize findings.
- Specific: describes a condition precisely (e.g., “no contract tests between Service A and B”) rather than vague (“poor communication”).
- Evidence-backed: supported by artifacts (logs, tickets, configs, metrics) or consistent witness accounts.
- Mechanistic: explains the pathway from cause to failure (how it produced the outcome).
- Controllable: something the organization can change (process, tooling, decision rights, architecture).
- Preventive: changing it would reduce recurrence, not just improve detection after the fact.
- Testable: you can define a verification signal that the fix is working.
Practical RCA Workflow for a Complex Delivery Failure (Combine Methods)
The following workflow is a pragmatic way to run RCA when the failure spans multiple teams and systems. It avoids repeating early-stage triage and focuses on analysis and synthesis.
Step-by-step workflow
- Step 1: Select 1–3 critical failure modes. Example set: “integration defects discovered late,” “release rollback required,” “vendor dependency caused slip.” Keep the set small to avoid analysis paralysis.
- Step 2: Build a timeline for each failure mode. Use evidence links and mark decision points.
- Step 3: Run a fishbone to enumerate contributing factors. Attach evidence tags; discard disproven items.
- Step 4: Deepen the top candidates with 5 Whys and/or FTA. Use 5 Whys for causal chains; use FTA when multiple branches can produce the same top event.
- Step 5: Map controls with Bowtie. Identify missing or weak prevention barriers and mitigation barriers.
- Step 6: Prioritize countermeasures with FMEA. Choose actions that reduce recurrence fastest with available capacity.
- Step 7: Define verification signals and “control owners.” Each countermeasure needs an owner and a metric or audit mechanism.
Examples of Root Causes and Better Rewrites
Delivery RCA often fails because causes are written as judgments. Below are common weak statements and improved, actionable rewrites.
- Weak: “Developers didn’t test enough.” Better: “No automated regression suite for checkout; manual regression exceeded available time, so coverage dropped below agreed threshold; pipeline allowed deploy without coverage evidence.”
- Weak: “Requirements were unclear.” Better: “Acceptance criteria for 12 stories lacked edge-case rules; review checklist did not require example scenarios; defects clustered around missing rules.”
- Weak: “Too many dependencies.” Better: “Three upstream services changed APIs without versioning; no contract tests or change notification; integration broke during final month.”
- Weak: “Poor communication between teams.” Better: “No defined interface owner; changes were announced in chat but not tracked; dependent team had no alerting for breaking changes; integration issues surfaced only in end-to-end tests.”
- Weak: “Lack of ownership.” Better: “Decision rights for release go/no-go were split across two managers; no delegate policy; approvals blocked hotfix for 10 hours.”
Facilitating RCA Sessions Without Creating Defensiveness
Complex delivery failures involve many contributors. If participants feel threatened, they will optimize for self-protection, not truth. Facilitation techniques help keep the analysis rigorous and psychologically safe without becoming vague.
Practical facilitation techniques
- Separate facts from interpretations. Maintain two columns: “Observed” vs “Hypothesis.” Promote hypotheses only when evidence is attached.
- Use “conditions, not culprits” language. Ask “What conditions made this outcome likely?” rather than “Who caused this?”
- Timebox debates and assign evidence tasks. If a claim cannot be resolved in 5 minutes, assign someone to fetch logs/tickets and move on.
- Normalize trade-offs. Many “bad” decisions were rational under constraints. Capture constraints explicitly (time, tooling, policy).
- Require countermeasure specificity. If someone proposes “improve communication,” ask for the mechanism: “What artifact, cadence, or gate changes? How will we know it worked?”
From Root Causes to Recovery Plan Inputs
RCA is only valuable if it produces inputs that can be executed during recovery. Convert each validated root condition into a change package with clear scope and verification.
Countermeasure design checklist
- Control type: prevention (stop it happening), detection (find it fast), mitigation (limit impact).
- Placement: where in the delivery flow the control lives (design, build, test, deploy, operate).
- Owner: a role/team accountable for implementing and maintaining the control.
- Verification: metric, audit, or automated check that proves the control is active.
- Failure mode coverage: which cut set or fishbone branch it addresses.
- Side effects: added cycle time, cost, or complexity; how you will manage these.
Example conversion: Root condition: “No environment parity; production uses different database parameters than staging.” Countermeasure: “Infrastructure-as-code for DB parameters; nightly drift detection; staging mirrors production parameter set; deployment gate fails on drift.” Verification: “Drift alerts count; parity checklist pass rate; reduction in environment-specific incidents.”