Why KPI design is different for alliances
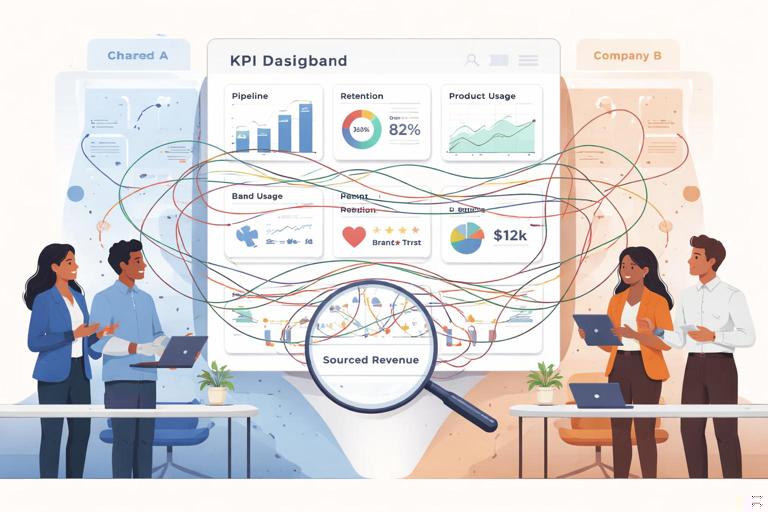
What makes alliance KPIs tricky: Alliances create value through shared activities, shared audiences, and shared workflows. That means outcomes often show up in more than one place (pipeline, retention, product usage, brand trust, cost-to-serve), and the “cause” is distributed across both companies. If you measure alliances with only one metric (for example, sourced revenue), you will undercount impact and over-incentivize short-term behavior.
What good alliance KPIs do: They translate the alliance strategy into observable signals, align both partner teams on what “winning” means, and create a feedback loop for decisions (double down, fix, or stop). A good KPI set includes (1) leading indicators that predict outcomes, (2) lagging indicators that confirm outcomes, and (3) health metrics that prevent hidden failure (like partner fatigue or low-quality leads).
Common failure patterns: (a) measuring only what is easy to count (clicks, leads) instead of what matters (qualified pipeline, activation), (b) using different definitions across partners (what counts as “SQL” or “active user”), (c) setting targets without a baseline, and (d) ignoring attribution rules, which causes disputes later.
Define success criteria before you define KPIs
Success criteria vs. KPIs: Success criteria are the decision rules that determine whether the alliance is working. KPIs are the measurements that feed those rules. For example, a success criterion might be “By end of quarter two, the alliance should produce repeatable co-sell motion with predictable pipeline.” The KPIs might include “partner-influenced opportunities per month,” “stage-to-stage conversion,” and “time-to-first-joint-opportunity.”
Three layers of success criteria: (1) Business outcomes (revenue, margin, retention, cost reduction), (2) Motion outcomes (repeatability, velocity, coverage, adoption of the joint process), and (3) Relationship outcomes (trust, responsiveness, executive engagement, conflict resolution). Alliances fail when relationship outcomes degrade even if early numbers look good.
- Listen to the audio with the screen off.
- Earn a certificate upon completion.
- Over 5000 courses for you to explore!

Download the app
Example: A cybersecurity vendor partners with a managed service provider. Business outcome: $500k in closed-won within 6 months. Motion outcome: at least 8 joint account plans executed and 20 partner seller trainings completed. Relationship outcome: average response time to shared leads under 48 hours and monthly exec check-ins maintained. If the MSP stops responding quickly, the alliance is at risk even if early pipeline exists.

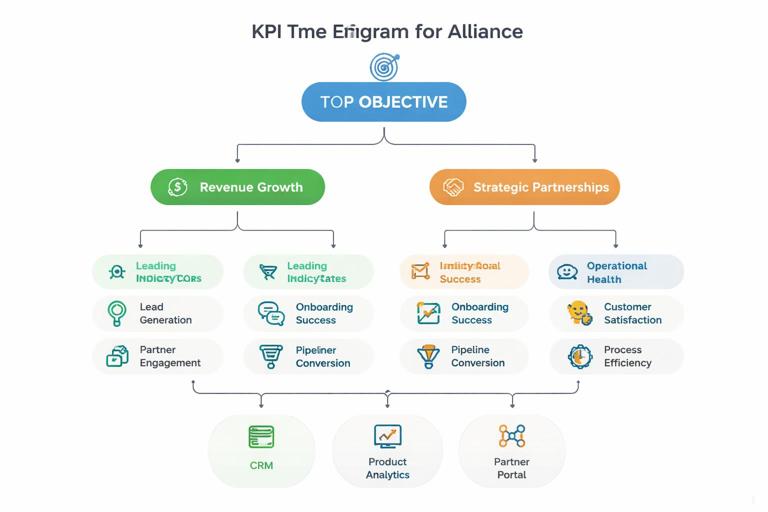
Step-by-step: Build a KPI tree for an alliance
Step 1 — Start with the alliance objective: Write one sentence that includes the target customer, the joint motion, and the primary value. Example: “Drive mid-market adoption of our compliance module by bundling it into partner onboarding projects.” This prevents KPIs from drifting into unrelated activity tracking.
Step 2 — Choose 1–2 primary outcome KPIs: Pick the few metrics that define the end result. Typical choices: closed-won revenue, net revenue retention for partner-referred customers, attach rate of a joint bundle, or cost savings from shared delivery. Keep it minimal so the alliance has a clear scoreboard.
Step 3 — Map the causal chain (leading indicators): Ask: “What must be true, earlier, for the outcome to happen?” For a co-sell alliance, leading indicators often include: number of partner-introduced opportunities, acceptance rate of introductions, joint discovery calls completed, and stage conversion rates. For an integration alliance, leading indicators might be: integration activation rate, number of accounts enabling the integration, and weekly active usage of integrated features.
Step 4 — Add quality gates: Alliances can generate volume without value. Add metrics that protect quality, such as: % of leads meeting ICP criteria, average deal size vs. baseline, churn rate of partner-sourced customers, or implementation success rate. Quality gates stop teams from “gaming” the system.
Step 5 — Add operational health metrics: Track the mechanics that keep the alliance functioning: SLA adherence (lead response time), enablement completion, number of joint pipeline reviews held, and partner satisfaction score (simple quarterly survey). These metrics are not vanity; they predict whether the motion is sustainable.
Step 6 — Define formulas and owners: Every KPI needs a definition, a formula, a data source, a cadence, and an owner. Example: “Partner-influenced pipeline = sum of opportunity amount where partner is listed as influence touch within 90 days before opportunity creation; source: CRM; owner: partnerships ops; cadence: weekly.”
Step 7 — Set targets using baselines and ranges: Use historical conversion rates where possible. If you lack baselines, set a range (floor, target, stretch) and commit to revising after 30–60 days. Targets should be realistic enough to drive behavior without forcing manipulation.
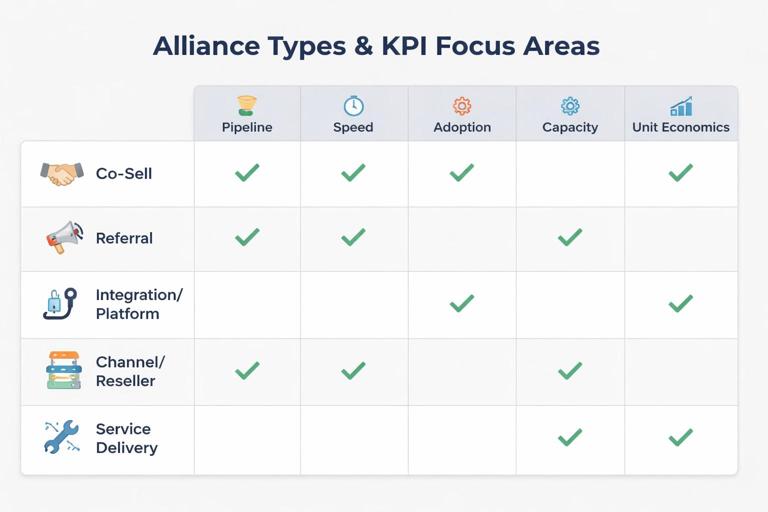
Choose the right KPI categories for your alliance type
Co-sell alliances: Focus on pipeline creation, pipeline progression, and win rate. Useful KPIs include: partner-sourced opportunities, partner-influenced opportunities, average sales cycle length vs. non-partner deals, win rate uplift, and multi-threading depth (number of stakeholders engaged). Practical example: If partner-influenced deals close 20% faster, that is a strong success signal even if sourced volume is moderate.
Referral alliances: Focus on lead quality and speed. KPIs: referral acceptance rate, time-to-first-contact, meeting-to-opportunity conversion, and revenue per referral. Add a “dispute rate” metric (how often attribution is contested) to detect process gaps.
Integration or platform alliances: Focus on adoption and retention. KPIs: integration activation rate, % of new customers enabling integration within 30 days, weekly active integrated users, feature usage depth, and churn/expansion deltas for integrated vs. non-integrated accounts. Example: “Customers with the integration enabled have 15% higher retention” is often more valuable than raw activation counts.
Channel/reseller alliances: Focus on partner capacity and coverage. KPIs: partner-seller certification completion, number of active selling partners, pipeline per partner, close rate by partner tier, and margin contribution. Also track “partner concentration risk” (share of revenue from top 1–3 partners).
Service delivery alliances: Focus on delivery quality and unit economics. KPIs: implementation cycle time, project gross margin, rework rate, customer satisfaction, and escalation frequency. These alliances can look successful on revenue while quietly destroying margin if delivery metrics are ignored.
Attribution: decide what you will credit, when, and why
Attribution is a policy, not a spreadsheet: In alliances, attribution determines incentives and trust. If the rules are unclear, teams will fight over credit, and the alliance will slow down. Define attribution early, document it, and align it with your compensation and partner benefits.
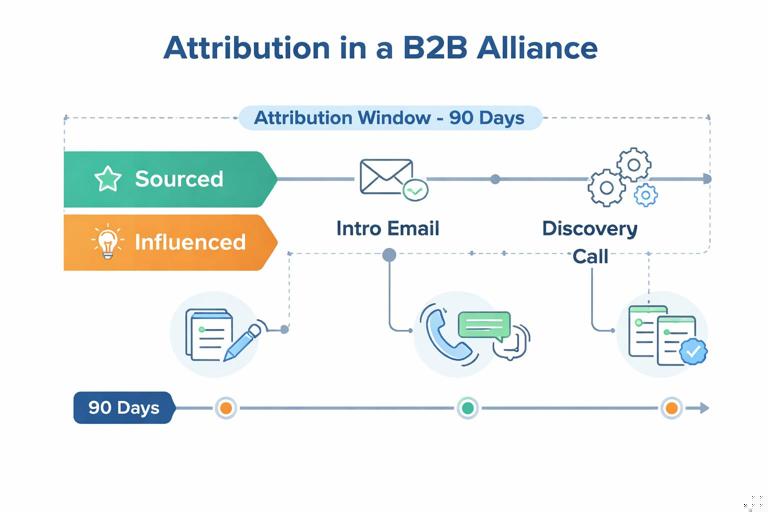
Key attribution questions: (1) What counts as “sourced” vs. “influenced”? (2) What is the attribution window (30/60/90/180 days)? (3) What evidence is required (intro email, meeting, joint call, integration event)? (4) How do you handle multiple partners touching the same account? (5) What happens if the customer was already in pipeline?
Practical definitions: Partner-sourced means the partner initiated the opportunity (first identified the customer need and introduced you before you had an active opportunity). Partner-influenced means the partner materially increased the probability or speed of closing (for example, joined discovery, provided technical validation, or delivered implementation plan) even if you originated the lead.
Step-by-step: Implement an attribution model that won’t create conflict
Step 1 — Pick a model that matches your maturity: Early-stage alliances often start with simple rules: “first-touch partner gets sourced credit if no open opportunity existed.” As you scale, you can add multi-touch influence and weighting. Complexity is only helpful if you can reliably capture the data.
Step 2 — Define the minimum evidence standard: Require a verifiable artifact. Examples: a CRM note with meeting date and attendees, an intro email forwarded to a shared alias, a partner portal referral form, or integration telemetry event. Avoid “trust me” attribution.
Step 3 — Establish an attribution window: Choose a time window that reflects your sales cycle. If your average cycle is 90 days, a 30-day window will undercount partner influence. A common starting point is 90 days for influenced credit and 180 days for sourced credit in complex B2B, but the right number depends on your motion.
Step 4 — Handle pre-existing pipeline explicitly: Create rules like: “If an opportunity exists in CRM before the partner touch, the partner can earn influenced credit but not sourced credit.” Also define what counts as “exists” (open opportunity in last X days, not closed-lost more than Y days ago).
Step 5 — Decide on multi-partner scenarios: Options include: (a) split influence equally, (b) weight by role (introducer vs. implementer), or (c) cap the number of credited partners per deal to reduce noise. Document the rule and apply it consistently.
Step 6 — Create a dispute process: Disputes are normal. Define a short process: submit evidence within 14 days, partnerships ops reviews, final decision in weekly cadence. Track dispute rate as a KPI; rising disputes often signal unclear definitions or missing data capture.
Design KPIs that are measurable with your actual data
Start from systems of record: Most alliance KPI programs fail because they assume perfect tracking. Build KPIs around what you can reliably capture in CRM, product analytics, partner portal, and support systems. If a metric requires manual spreadsheets every week, it will degrade.
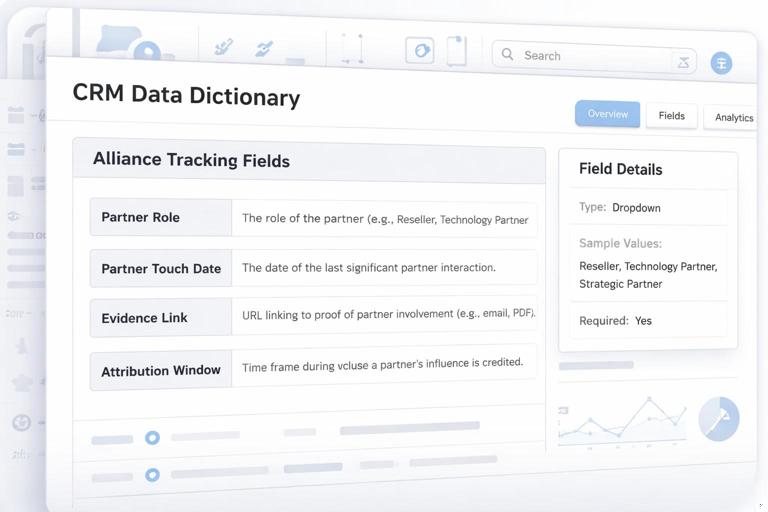
Minimum viable instrumentation: For co-sell and referral alliances, you need: partner field on account and opportunity, partner role (sourced/influenced), partner touch date, and a way to log joint activities (call, demo, workshop). For integration alliances, you need: integration enabled flag, activation date, and usage events tied to account ID.
Example data dictionary snippet: “Partner_Touch_Date = earliest date of verified partner activity related to the opportunity; allowed sources: referral form timestamp, intro email timestamp, meeting date in calendar sync; stored on opportunity object; required for influenced credit.” Defining this prevents inconsistent reporting.
Set targets and thresholds that drive the right behavior
Use thresholds to trigger actions: Instead of only tracking numbers, define what happens when a KPI crosses a line. Example: “If referral acceptance rate drops below 60% for two weeks, run a lead-quality review with partner and update ICP filters.” This turns KPIs into operating mechanisms.
Balance volume, quality, and speed: A practical trio for referral alliances is: (1) number of referrals, (2) % accepted, (3) median time-to-first-contact. If you only target volume, quality collapses. If you only target acceptance, partners may stop sending. If you only target speed, teams may rush unqualified calls.
Include counter-metrics: Counter-metrics prevent gaming. If you reward “partner-sourced pipeline,” add a counter-metric like “stage 2+ conversion rate” or “closed-lost reason distribution.” If pipeline grows but conversion collapses, you know the motion is generating noise.
Operationalize KPI reviews: cadences, dashboards, and decision logs
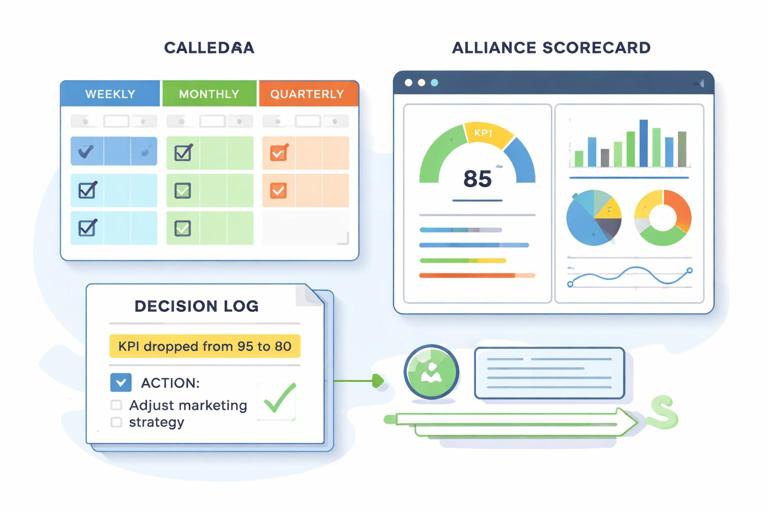
Cadence design: Use three rhythms: weekly (tactical pipeline and SLA), monthly (trend review and experiments), quarterly (success criteria check and renegotiation of targets). Weekly should be short and action-oriented; quarterly should revisit whether the alliance still matches strategic priorities.
Dashboard structure: Build one shared “alliance scorecard” with sections: Outcomes (lagging), Leading indicators, Quality gates, Health metrics. Keep each section to 3–5 metrics. Too many metrics create debate instead of decisions.
Decision log: Record decisions tied to KPI movement: “Because activation rate fell from 40% to 25%, we changed onboarding to include integration step and added partner enablement session.” This creates institutional memory and reduces repeated arguments.
Examples of alliance KPI scorecards (templates you can adapt)
Template A — Co-sell scorecard: Outcomes: closed-won revenue (partner-influenced), win rate uplift vs. baseline. Leading: new partner-introduced opportunities/week, joint discovery calls/week, stage 1→2 conversion. Quality: average deal size vs. baseline, % opportunities with mutual account plan attached. Health: lead response SLA, attendance rate at pipeline reviews.
Template B — Integration scorecard: Outcomes: retention delta for integrated accounts, expansion revenue from integrated accounts. Leading: activation rate within 30 days, weekly active integrated accounts, key event completion (e.g., “sync completed”). Quality: support tickets per 100 integrated accounts, time-to-value. Health: integration uptime, partner engineering response time.
Template C — Service delivery scorecard: Outcomes: services gross margin, renewal rate for jointly delivered customers. Leading: projects started/month, utilization rate, implementation cycle time. Quality: CSAT/NPS for delivered projects, rework rate, escalation count. Health: staffing coverage, backlog age.
Align incentives and governance with the KPI system
Incentives must match attribution: If sales compensation pays only on sourced revenue but your alliance creates mostly influenced revenue, sellers will ignore it. Decide whether influenced credit affects comp, SPIFFs, or non-monetary rewards (priority leads, MDF access, tier status). Misalignment here is one of the fastest ways to kill momentum.
Governance roles: Assign clear owners: partnerships lead (overall), sales ops (CRM fields and reporting), product/engineering (integration telemetry), customer success ops (retention and adoption), and a partner counterpart for shared review. Without owners, KPIs become “interesting” rather than actionable.
Document the operating agreement: Put KPI definitions, attribution rules, cadences, and dispute process into a short operating document shared with the partner. This is not legal language; it is a working manual that prevents misunderstandings and accelerates execution.
Advanced: measuring incremental impact (incrementality) without perfect experiments
Why incrementality matters: Partner-influenced revenue can be real, but some deals would have closed anyway. Incrementality asks: “What changed because of the alliance?” This helps you allocate budget and attention to the alliances that truly move outcomes.
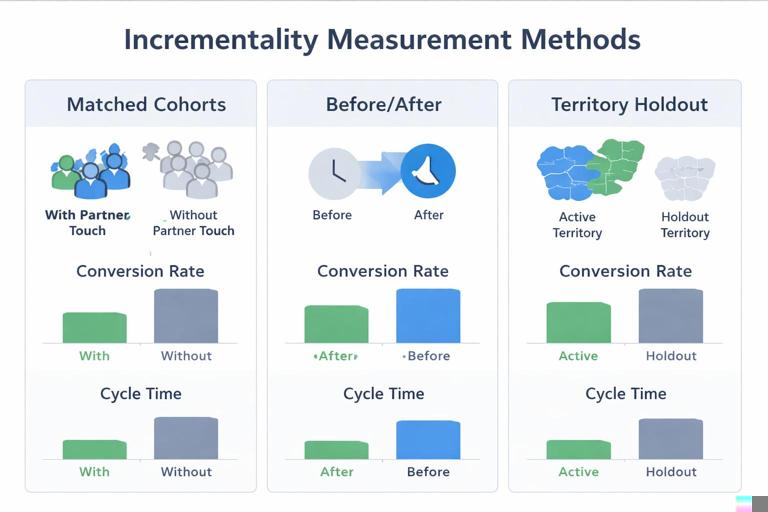
Practical approaches: (1) Matched cohort comparison: compare similar accounts with and without partner touch (same segment, size, region) and track conversion and cycle time. (2) Before/after within the same partner: compare performance pre- and post-enablement or pre- and post-integration launch. (3) Holdout by territory or segment: run the alliance motion in one region and not another for a defined period, then compare. These are not perfect, but they are often good enough for decision-making.
Incrementality KPI examples: cycle time reduction (%), win rate uplift (percentage points), retention uplift, and CAC reduction due to partner-supplied demand. Tie these to success criteria like “Alliance must improve win rate by 5 points in target segment within two quarters.”
Practical checklist: launch-ready KPI and attribution setup
- Success criteria written in outcomes, motion, and relationship terms
- 1–2 primary outcome KPIs selected and agreed by both sides
- KPI tree built with leading indicators, quality gates, and health metrics
- Definitions documented (formula, data source, owner, cadence)
- Attribution policy documented (sourced vs influenced, window, evidence, multi-partner rule)
- CRM fields and required workflow implemented (partner role, touch date, evidence link)
- Dashboard created with no more than 12–15 total metrics
- Weekly/monthly/quarterly review cadences scheduled with agendas tied to KPIs
- Dispute process defined and dispute rate tracked
- Decision log template created and used
// Example: simple attribution rules (starter version) Sourced credit: Partner introduced account AND no open opportunity existed in last 120 days AND evidence attached (intro email or referral form). Influenced credit: Partner participated in at least one verified activity (joint call, workshop, technical validation) within 90 days before close OR within 30 days after opportunity creation. Multi-partner: Max 2 partners can receive influenced credit; sourced credit is exclusive. Disputes: Submit within 14 days with evidence; partnerships ops decides in weekly review.