Why Checklists and Templates Matter in Data Storytelling Work
Checklists, templates, and a pitfall playbook turn “good intentions” into repeatable quality. In Power BI work, the same types of mistakes recur: unclear definitions, inconsistent formatting, missing context, fragile measures, confusing interactions, and last-minute stakeholder changes. A checklist reduces cognitive load by externalizing what must be verified. A template accelerates setup and enforces consistency. A pitfall playbook captures hard-won lessons so teams stop relearning them on every dashboard.
Think of these tools as guardrails for executive-ready storytelling: they do not replace judgment, but they ensure the basics are always covered. They also make collaboration easier: reviewers know what “done” means, new team members ramp faster, and stakeholders experience a consistent look and feel across reports.

How to Use This Chapter
This chapter provides three assets you can adopt immediately: (1) checklists for each stage of dashboard creation and review, (2) templates you can copy into your own documentation and Power BI files, and (3) a pitfall playbook with symptoms, root causes, and fixes. Use them as living documents: start small, apply them to one report, then refine based on what you learn.
Checklist 1: Executive Story Readiness (One-Page Review)
Use this checklist when you believe a report is “almost done” and you need to validate that it communicates clearly to an executive audience. It is intentionally short and outcome-focused so it can be completed in 10–15 minutes.
- Purpose is explicit: The report answers a specific decision question (not “explore the data”).
- Audience assumptions are correct: Terminology matches how leaders speak (e.g., “Bookings” vs. “Revenue recognized”).
- Key message is visible in 5 seconds: The first screen makes the main point obvious without clicking.
- Context is present: Time period, scope, and definitions are visible (or one click away) for every key metric.
- Comparisons are meaningful: Targets, prior period, or benchmarks are included where they change interpretation.
- Actionability is clear: The report suggests what to do next (e.g., “Investigate Region X decline”) via annotations, tooltips, or a dedicated “Drivers” section.
- Visual hierarchy is consistent: The most important elements are largest and placed where the eye lands first.
- Interactivity is intentional: Slicers and drill actions support the story; nothing feels like a random “filter playground.”
- Trust signals exist: Data freshness, source, and last refresh time are visible; definitions are accessible.
- Edge cases handled: No broken visuals, blank cards, or misleading zeros when filters remove data.
Checklist 2: Metric Definition and Consistency
Executives lose trust quickly when the same metric changes across pages or when a number cannot be explained. This checklist focuses on metric clarity and consistency across the report.
- Listen to the audio with the screen off.
- Earn a certificate upon completion.
- Over 5000 courses for you to explore!

Download the app
- Metric dictionary exists: Each KPI has a name, definition, inclusion/exclusion rules, and grain (daily, weekly, monthly).
- Units and formatting are consistent: Currency symbol, decimal places, thousands separators, and abbreviations (K/M/B) match across pages.
- Time logic is consistent: “Month-to-date” and “Last 30 days” are not mixed without explicit labeling.
- Filters are disclosed: If a KPI excludes a segment (e.g., “Enterprise only”), it is labeled near the KPI.
- Totals behave as expected: Matrix totals and subtotals align with business logic (no surprising totals due to non-additive measures).
- Rounding is controlled: Display rounding does not hide meaningful differences; tooltips show precise values when needed.
- Negative values are handled: Returns, refunds, and reversals are represented consistently (sign conventions are documented).
- Null vs. zero is intentional: Missing data is not silently converted into zero unless that is correct.
Checklist 3: Interaction and Navigation Quality
Many dashboards fail not because the numbers are wrong, but because the user experience creates confusion. Use this checklist to validate that interactions support the narrative and reduce friction.
- Navigation is predictable: Page names match user tasks (e.g., “Overview,” “Drivers,” “Details,” “Definitions”).
- Slicers are minimal and high-value: Only include slicers that change decisions; avoid redundant slicers.
- Default state is useful: When the report opens, it shows a meaningful view (not “All time, all regions, all products” unless that is intended).
- Cross-highlighting is controlled: Visual interactions are enabled only where they add clarity; otherwise they are disabled to prevent accidental confusion.
- Drill-down paths are logical: Hierarchies match how the business thinks (e.g., Region → Country → City).
- Tooltips add explanation: Tooltips provide definitions, drivers, or micro-trends rather than repeating the same number.
- Bookmarks are stable: Bookmarks do not unexpectedly change filters or hide critical elements.
- Mobile layout considered: If leaders view on mobile, key KPIs and the main narrative fit the mobile canvas.
Checklist 4: Data Quality and Reconciliation (Report-Level)
This checklist helps you confirm that the report’s numbers reconcile with trusted references and that common data issues are surfaced rather than hidden.
- Reconciliation targets identified: You know what system or report is the “source of truth” for each KPI.
- Reconciliation performed: Key totals match within an agreed tolerance; differences are explained and documented.
- Freshness is validated: Refresh schedule aligns with business cadence; late refreshes are visible.
- Outliers reviewed: Spikes/drops are checked for data issues (duplicates, missing days, late postings).
- Row counts and distinct counts checked: Basic sanity checks are performed for major entities (customers, orders, products).
- Filter leakage tested: Slicers do not unintentionally filter unrelated visuals due to relationships or interactions.
- Security tested: If role-based access exists, each role sees only permitted data and totals remain consistent.
Template 1: KPI Definition Card (Copy/Paste)
Use this template in a shared document or as a hidden “Definitions” page inside the report. The goal is to make metric debates faster and to keep definitions stable over time.
KPI Name: [e.g., Net Revenue] Owner: [Finance / Sales Ops] Version: [v1.2] Last Updated: [YYYY-MM-DD] Business Question: [What decision does this KPI support?] Definition (Plain Language): [One sentence definition] Calculation Rules: - Included: [list] - Excluded: [list] - Returns/Refunds handling: [rule] - Currency conversion: [rule] Grain and Time Logic: - Grain: [daily/transaction/monthly] - Time zone: [UTC/local] - MTD/QTD/YTD definition: [rule] Dimensions that affect it: - Customer segment: [rule] - Product category: [rule] Known Caveats: - [e.g., data lags by 24 hours] - [e.g., excludes manual adjustments] Validation: - Reconciles to: [system/report] - Expected tolerance: [+/- X% or amount] Display Standards: - Format: [$#,##0.0,,"M"] - Color rules: [e.g., red if below target] Related Measures: [links/names]Template 2: Page Blueprint (Layout and Story Intent)
A page blueprint prevents “design drift” across multiple authors and pages. It also makes reviews faster because stakeholders can comment on intent, not just visuals.
Page Name: [Overview / Drivers / Details] Primary Message: [One sentence] Primary KPI(s): [list] Secondary KPI(s): [list] Required Comparisons: [Target, Prior Period, Benchmark] Visual Inventory: 1) [Visual type] - Purpose: [why it exists] - Fields/measures: [list] - Interaction: [filters/highlights/drill] 2) ... Filters/Slicers: - Global slicers: [list] - Page-only slicers: [list] Annotations/Explanations: - [Callout text, tooltip content, definitions link] Accessibility/Readability: - Minimum font size: [e.g., 11] - Color contrast check: [yes/no] Acceptance Criteria: - User can answer: [question] within [time] - No more than [N] clicks to reach detailsTemplate 3: Stakeholder Review Script (15-Minute Walkthrough)
Instead of asking “What do you think?”, use a structured script that elicits actionable feedback and reduces scope creep. This template also creates a record of decisions.
Meeting Goal: Validate story + KPI definitions + usability Attendees: [names/roles] Timebox: 15 minutes 1) Decision Question (2 min) - Does this report answer: [question]? - What decision will you make with it? 2) KPI Trust Check (5 min) - Do these KPIs match your definitions? - Any missing segmentation that changes interpretation? - Do totals reconcile with your reference? 3) Story Flow (5 min) - Is the first page enough to brief leadership? - What is the first follow-up question you would ask? - Can you reach that answer in 1–2 clicks? 4) Action and Ownership (3 min) - What action would you take if KPI is up/down? - Who owns the next step? Decisions and Changes Log: - Approved: [list] - Change requests: [list] - Deferred: [list] - Open questions: [list] Next Review Date: [YYYY-MM-DD]Template 4: Change Log and Versioning (Lightweight)
Dashboards evolve. Without a simple change log, teams lose track of why numbers changed, which damages trust. Keep this log in a shared document or inside the report as a hidden page.
Report Name: [name] Owner: [name] Version: [vX.Y] Date: [YYYY-MM-DD] Change Type: [Bug fix / Enhancement / Definition change / Data source change] Summary: [1-2 sentences] Details: - What changed: [list] - Why: [reason] - Impacted pages/KPIs: [list] Validation Performed: - Reconciliation: [yes/no + notes] - Role testing: [yes/no] - Performance spot check: [yes/no] Stakeholder Approval: [name + date]Pitfall Playbook: Common Failure Modes and How to Fix Them
This playbook is organized as “symptom → likely root cause → fix → prevention.” Use it during debugging, peer review, and stakeholder feedback cycles. Over time, add your organization’s specific pitfalls (for example, fiscal calendar quirks or regional data lags).
Pitfall 1: “The KPI changed since last week”
Symptom: Stakeholders report that a headline number is different from what they saw earlier, even with the same filters. Likely root causes: late-arriving data, changed business rules, refreshed historical records, or a measure definition update. Fix: verify refresh timestamps, compare versions, and reconcile against a reference extract for the same date. If the definition changed, document it and communicate it explicitly. Prevention: maintain a change log, display “Last refresh” and “Data through” dates, and version KPI definitions.
Pitfall 2: “Totals don’t match the detail table”
Symptom: A card shows one value, but a table of rows sums to something else. Likely root causes: non-additive measures, filter context differences, hidden filters, or mismatched granularity. Fix: test the measure under different contexts, inspect visual-level filters, and validate relationships that might be changing filter propagation. Prevention: include a reconciliation visual (e.g., total vs. sum of components) on a QA page and standardize how totals should behave for each KPI.
Pitfall 3: “The report is correct, but executives still don’t get it”
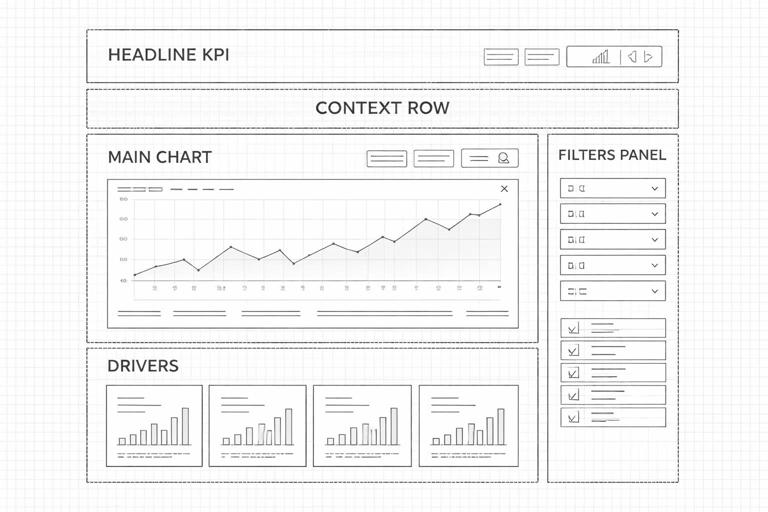
Symptom: Users ask basic questions repeatedly (“What time period is this?” “Is this gross or net?”). Likely root causes: missing context, unclear labeling, or too much reliance on implicit knowledge. Fix: add explicit time period labels, definitions tooltips, and short callouts that interpret the chart (“Decline driven by Segment B”). Prevention: run the Executive Story Readiness checklist and require a “context row” near top KPIs (scope, time, currency, refresh).
Pitfall 4: “Slicers create weird results”
Symptom: Selecting a slicer causes unrelated visuals to change unexpectedly, or some visuals go blank. Likely root causes: unintended relationships, bidirectional filtering, or uncontrolled visual interactions. Fix: review relationships and filter directions, then adjust visual interactions so only intended visuals respond. Prevention: define a slicer strategy: which slicers are global, which are page-only, and which visuals should ignore certain slicers.
Pitfall 5: “We have five versions of the same report”
Symptom: Different teams share screenshots from different files, each with slightly different numbers or layouts. Likely root causes: lack of ownership, unclear release process, and ad hoc copies for “quick changes.” Fix: designate a single owner and a single canonical location for the report; consolidate changes into one version and retire old links. Prevention: implement lightweight versioning and a change request process, even if it is just a shared backlog and a weekly release cadence.
Pitfall 6: “The dashboard looks polished, but it’s hard to scan”
Symptom: Users spend time hunting for the main point; the page feels busy. Likely root causes: too many visuals, inconsistent alignment, competing colors, or no clear hierarchy. Fix: reduce visuals to the minimum needed for the decision, align elements to a grid, and reserve strong colors for meaning (alerts, highlights). Prevention: adopt a page blueprint template and enforce a consistent theme with standardized typography and spacing rules.
Pitfall 7: “Numbers are right, but the story is misleading”
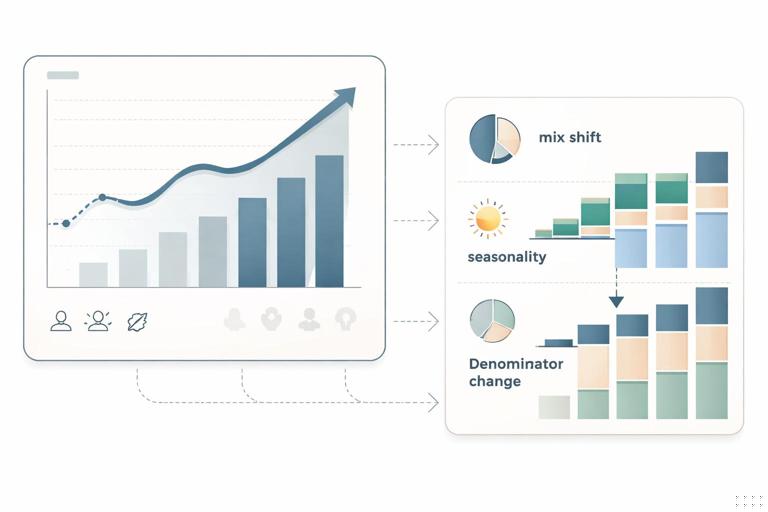
Symptom: A chart implies improvement/decline, but the change is due to mix shifts, seasonality, or a denominator change. Likely root causes: missing comparisons, missing denominator context, or inappropriate aggregation. Fix: add the right comparator (target/prior period), show rates alongside counts, and include driver breakdowns that explain composition. Prevention: require a “so what changed?” section on key pages and validate that each headline KPI has at least one driver view.
Pitfall 8: “Stakeholders keep requesting ‘just one more’ metric”
Symptom: Scope expands continuously, and the report becomes bloated. Likely root causes: unclear acceptance criteria and lack of prioritization. Fix: use the stakeholder review script to tie each request to a decision; if it does not change a decision, defer it. Prevention: define acceptance criteria per page (what questions must be answerable) and cap the number of KPIs per page.
Step-by-Step: Building Your Own “QA and Release” Routine
This routine turns the checklists and templates into an operational habit. The goal is to catch issues before executives do, and to make releases predictable.
Step 1: Create a hidden QA page inside the report
Add a page that is not part of normal navigation. Include: (1) a table of key KPIs by month, (2) a reconciliation visual against a known total, (3) a “data through” date card, and (4) a small section listing known caveats. This page is for builders and reviewers, not executives.
Step 2: Run the four checklists in a fixed order
Use a consistent sequence: start with Data Quality and Reconciliation, then Metric Definition and Consistency, then Interaction and Navigation, and finish with Executive Story Readiness. This order prevents you from polishing UX before confirming trustworthiness.
Step 3: Log changes and decisions immediately
After each review cycle, update the change log template. If a KPI definition changes, update the KPI definition card and record who approved it. This creates institutional memory and reduces future debates.
Step 4: Do a “cold read” test with a non-builder
Ask someone who did not build the report to open it and answer three questions: (1) What is the main message? (2) What would you do next? (3) What do you not understand? Capture their feedback verbatim. This test is one of the fastest ways to detect missing context and confusing interactions.
Step 5: Timebox stakeholder review using the script
Use the 15-minute walkthrough template. The timebox forces prioritization and keeps feedback focused on decisions, definitions, and usability rather than personal preferences.
Step-by-Step: Creating a Reusable “Starter Kit” for New Reports
To scale quality across multiple dashboards, package your assets into a starter kit that any analyst can use.
Step 1: Standardize documentation files
Create a shared folder with: KPI definition cards, page blueprint templates, the review script, and the change log. Provide examples of completed templates so people know what “good” looks like.
Step 2: Standardize report structure
Define a default set of pages (for example: Overview, Drivers, Details, Definitions, QA). Even if some reports do not need every page, a standard structure reduces navigation confusion across the portfolio.
Step 3: Standardize naming conventions
Agree on consistent names for measures, pages, and visuals. Consistent naming makes maintenance easier and reduces errors during handoffs and peer reviews.
Step 4: Add the pitfall playbook to your team’s review process
During peer review, ask reviewers to identify at least two potential pitfalls from the playbook and confirm they are addressed. Over time, this turns the playbook into a shared language for quality.