What A/B Testing Openings Actually Means (and What It Doesn’t)
A/B testing openings is the practice of publishing two (or more) versions of the first moments of a vertical video—typically the first 1–3 seconds—while keeping the rest of the video as similar as possible, then using performance signals to decide which opening is stronger. The goal is not to “find the perfect hook once,” but to build a repeatable iteration loop where each new upload teaches you what your audience responds to.
In short-form, the opening is a high-leverage variable because it influences whether viewers stay long enough to reach the rest of your story. But A/B testing is only useful when you treat it like an experiment: change one thing, measure the result, and iterate based on evidence rather than intuition.
What A/B testing is
- Controlled variation: You intentionally change one element in the opening (visual, line, pacing, first frame, on-screen text, etc.).
- Comparable distribution: You publish variants in a way that gives each a fair chance to reach similar viewers.
- Signal-based decision: You pick a winner based on metrics tied to retention and satisfaction, not just views.
What A/B testing is not
- Not “post twice and hope”: If the variants differ in multiple ways, you won’t know what caused the change.
- Not only about views: Views are heavily affected by distribution. Retention and rewatch behavior are more diagnostic.
- Not a one-time event: It’s a cycle: test → learn → update your opening playbook → test again.
Choose the Right Performance Signals for Openings
Openings should be evaluated with metrics that reflect early engagement and downstream satisfaction. Different platforms expose different analytics, but the underlying signals are similar.
Core signals (most useful for opening tests)
- 1-second view rate / “impressions to views”: A proxy for whether the first frame and immediate motion/clarity earned a stop. If this improves, your first frame and first beat are likely stronger.
- 3-second view rate: A stronger proxy for whether the opening actually holds attention beyond the initial stop.
- Average view duration (AVD): If only the opening changes, AVD shifts often indicate the opening’s ability to pull viewers into the rest.
- Average percentage viewed (APV): Helps normalize across different video lengths. For opening tests, APV is useful when variants are identical length.
- Retention curve shape in the first 5 seconds: Look for a steep initial drop (confusion/slow start) versus a flatter start (clarity/forward motion).
- Rewatches / loops: If the opening is intriguing or dense, rewatches can increase even if comments don’t.
Secondary signals (contextual, but still valuable)
- Saves: Often indicates perceived utility. For openings, a clearer promise can increase saves even if the rest is unchanged.
- Shares: Can reflect emotional resonance or usefulness. Be careful: shares may be driven by the ending, not the opening.
- Comments: Useful for qualitative feedback (“I thought this was about X”). But comments are noisy and can be influenced by prompts.
- Follows/subscribes per view: Indicates whether the opening sets expectations that match the value delivered.
Signals to treat carefully
- Total views: Strongly affected by timing, distribution, and platform testing. Use views as a context metric, not the primary decision-maker.
- Likes: Can correlate with satisfaction but often lags behind retention changes and varies by niche.
Define Your Test Objective Before You Edit
Every A/B test should have a single objective tied to a measurable signal. Otherwise, you’ll change multiple things and interpret results emotionally.
Common objectives for opening tests
- Increase “stop power”: Improve 1-second and 3-second view rate.
- Reduce early confusion: Flatten the first 3–5 seconds of the retention curve.
- Increase downstream completion: Improve AVD/APV by pulling more viewers into the middle.
- Increase qualified engagement: Improve saves/shares/follows without harming retention.
Write a testable hypothesis
Use a simple format: “If I change X in the first Y seconds, then metric Z will improve because…”
- Listen to the audio with the screen off.
- Earn a certificate upon completion.
- Over 5000 courses for you to explore!

Download the app
- Example: “If I replace a vague first line with a specific outcome statement in the first 0.5 seconds, then 3-second view rate will increase because viewers will understand the payoff immediately.”
- Example: “If I start with the result shot instead of the setup shot, then 1-second view rate will increase because the first frame will be visually self-explanatory.”
What to Test in the First 1–3 Seconds (Without Rebuilding the Whole Video)
To keep experiments clean, focus on variables that can be swapped while leaving the rest intact.
High-impact opening variables
- First frame selection: A clear “what is this?” frame versus an abstract or transitional frame.
- First action beat: Starting on motion (hands moving, object transforming, reaction) versus static talking.
- First line (spoken or on-screen): Specificity, stakes, curiosity, or clarity.
- On-screen text style for the first beat: One short promise line versus multiple lines; placement and size; whether it appears instantly or builds.
- Audio entry: Cold open with voice immediately versus a half-second of ambient sound; a sharp sound cue versus soft entry.
- Speed of context: How quickly the viewer understands who/what/why.
- Angle/shot choice: Close-up detail versus medium shot; direct-to-camera versus over-the-shoulder.
Keep these constant to avoid muddy results
- Total video length (or keep within a second).
- Core story beats after the opening (same order, same clips).
- Captioning approach (don’t change readability systems mid-test).
- Posting window (as consistent as possible).
Practical Step-by-Step: A Clean A/B Test Workflow
Step 1: Pick one video worth testing
Choose a video concept that already has a reasonable baseline (not a total outlier). If a video is extremely niche or extremely broad, distribution variance can overwhelm your test.
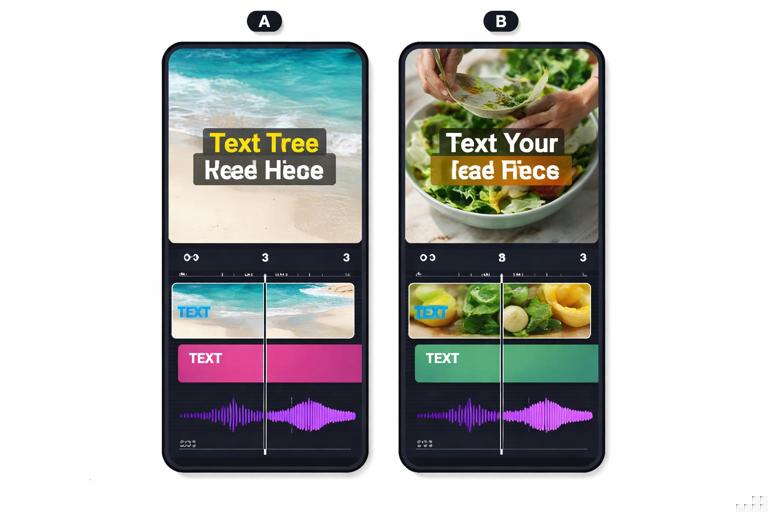
Step 2: Create two opening variants (A and B)
Limit changes to one primary variable. You can still make tiny technical adjustments (trim silence, align captions), but keep the “idea” of the opening change singular.
Example structure:
- Variant A: First frame is you holding the finished result; first line: “This takes 30 seconds.”
- Variant B: First frame is the problem state; first line: “If yours looks like this, do this.”
Step 3: Ensure both variants are equally “polished”
If one version has cleaner audio, brighter exposure, or tighter cuts, you’re testing production quality, not the opening idea. Do a quick checklist:
- Same loudness level and voice clarity
- Same color/contrast feel
- Same caption accuracy and timing
- Same thumbnail/cover selection if the platform uses one
Step 4: Decide your publishing method
How you publish depends on platform constraints. Use the method that best approximates equal opportunity distribution.
- Method 1: Sequential posting (most common): Post A, then B after a consistent delay (e.g., 24–72 hours), at the same time of day. This reduces audience-time variance.
- Method 2: Different platforms as “parallel tests”: Post A on Platform X and B on Platform Y at the same time. This is faster but less controlled because audiences differ.
- Method 3: Same platform, different accounts: If you manage multiple similar accounts, you can run A and B in parallel. Only do this if the audiences are comparable.
Step 5: Set a minimum data window
Don’t call winners too early. Short-form distribution often comes in waves. Use a minimum window such as:
- Time-based: 24–72 hours after posting
- View-based: Wait until each variant reaches a minimum number of views (pick a threshold that makes sense for your account size)
Use the same rule for both variants.
Step 6: Compare the right metrics in the right order
Use a simple decision sequence:
- First: 1-second and 3-second view rates (did it stop and hold?)
- Second: Retention curve in first 5 seconds (did it confuse?)
- Third: AVD/APV (did it pull people into the full video?)
- Fourth: Saves/shares/follows (did it attract the right viewers?)
Step 7: Document the learning (not just the winner)
Write down what changed and what moved. This is how you build an “opening library” that compounds over time.
Test: Opening A vs B (Video: [title/ID]) Variable changed: [first line specificity] Hypothesis: [why it should help] Result: - 1s view rate: A 62% | B 71% - 3s view rate: A 44% | B 55% - AVD: A 9.2s | B 10.1s Notes: B reduced early drop; comments mention “finally clear” Next test: Keep B structure; test first frame (result vs problem)Interpreting Retention Curves: What the Shape Tells You
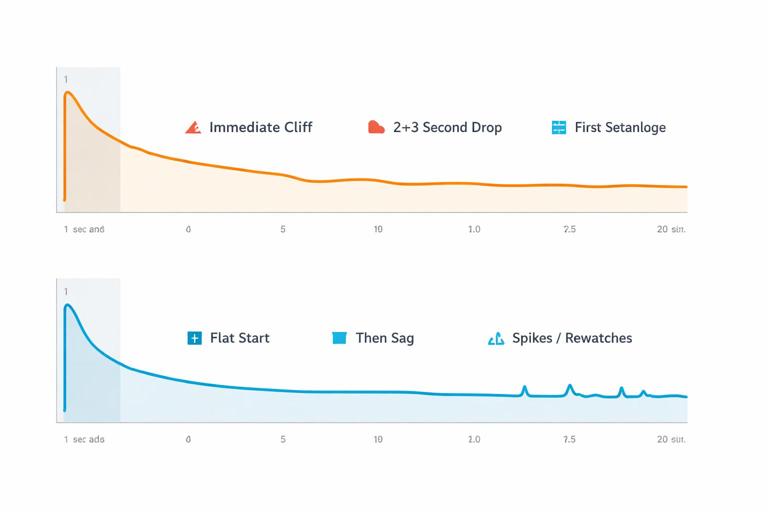
Retention curves are more diagnostic than single-number averages. When you A/B test openings, you’re looking for changes in the earliest segment of the curve.
Pattern: Immediate cliff in first second
- What it often means: First frame is unclear, visually low-contrast, or looks like an ad; audio starts late; viewer can’t categorize the video instantly.
- What to test next: Swap first frame to a clearer “category signal” shot; start voice on frame 1; remove pre-roll.
Pattern: Drop at 2–3 seconds
- What it often means: Viewer stopped, but the opening didn’t deliver clarity fast enough; promise is vague; context arrives late.
- What to test next: Make the first line more specific; add a single on-screen label; reorder the first two beats.
Pattern: Flat start, then mid-video sag
- What it often means: Opening works, but the middle loses momentum or the payoff is delayed.
- What to do (without changing the opening): This is not an opening problem. Don’t over-iterate the first second if the curve says the leak is later.
Pattern: Spikes (rewatches) near the opening
- What it often means: The opening is dense, surprising, or visually complex; viewers replay to understand.
- What to test next: Try a slightly clearer first caption or slower first cut while keeping the same idea, to convert rewatches into longer watch sessions.
Iteration Loops: Turning Signals into the Next Edit
Iteration is where A/B testing becomes a system. Each test should feed a specific next action rather than vague “make it better” notes.
Signal → Diagnosis → Edit move
- Low 1-second view rate: First frame doesn’t communicate category/value → Use a more legible first frame; add immediate motion; remove transitional frames.
- High 1-second but low 3-second: Stop is working but clarity/promise is weak → Rewrite first line to be specific; show the outcome earlier; reduce setup.
- Good early retention but low follows: Opening attracts broad viewers but doesn’t position you → Add a micro-positioning phrase in the first line (who it’s for) without adding length.
- Good retention but low shares/saves: Viewers watch but don’t perceive utility → Make the opening promise more “save-worthy” (checklist, steps, before/after) while keeping the same content.
Build an “opening playbook” from repeated wins
After several tests, you’ll notice patterns that consistently improve early retention. Turn those into reusable rules for your niche. Example playbook entries:
- “Start with the finished result in frame 1 when the topic is visual.”
- “Use a number in the first line when the value is procedural.”
- “Label the object/problem on screen within the first second for unfamiliar items.”
Practical Examples of Opening Variants (Same Video, Different First 2 Seconds)
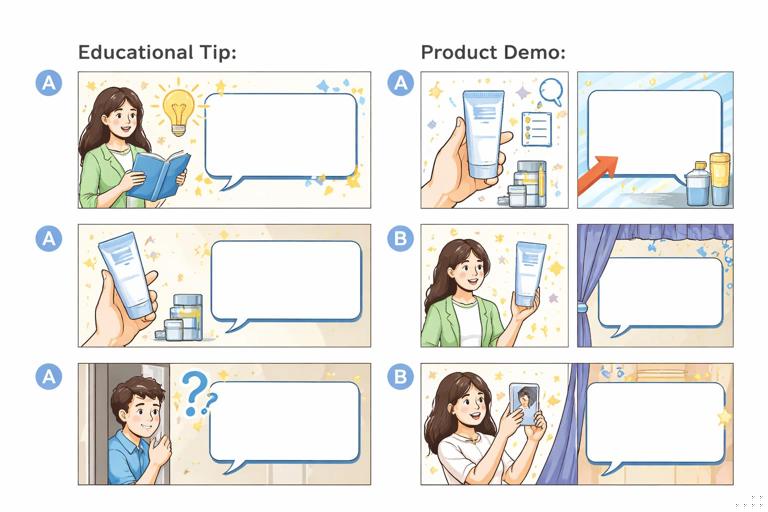
Example 1: Educational tip video
Goal: Improve 3-second view rate by increasing clarity.
- A (vague): “Here’s something most people don’t know…” (no object shown)
- B (specific): “If your phone videos look grainy indoors, change this setting.” (shows phone screen immediately)
What you’re testing: Specificity and immediate categorization. If B wins on 3-second view rate and early curve, you learned that your audience needs instant context, not mystery.
Example 2: Product demonstration
Goal: Improve 1-second view rate by making the first frame more scroll-stopping.
- A: Medium shot holding the product in packaging
- B: Extreme close-up of the product already in use with visible transformation
What you’re testing: First-frame legibility and motion. If B wins but A has more comments, you still choose B for retention, then add a comment prompt later rather than sacrificing the opening.
Example 3: Story-based reveal
Goal: Improve AVD by pulling viewers past the first beat.
- A: Starts with setup context
- B: Starts with the reveal line, then immediately flashes the “proof” shot, then returns to setup
What you’re testing: Whether front-loading proof reduces skepticism and increases commitment to watch.
How to Avoid False Winners (Common A/B Testing Traps)
Trap 1: Changing more than one major variable
If you change the first line, first frame, and pacing, you might get a winner but you won’t know why. Your next iteration becomes guesswork. Keep one primary variable per test.
Trap 2: Calling it too early
Early performance can flip after distribution expands. Use consistent windows and minimum view thresholds. If one variant is still in the “initial test pool,” wait.
Trap 3: Comparing across different lengths
If Variant B is shorter, APV may rise even if the opening isn’t better. Keep length constant when testing openings, or interpret APV with caution and prioritize early retention segments.
Trap 4: Letting comments override retention
Comments are valuable, but they can reward controversy or confusion. If Variant A gets more comments but loses early retention, it may be attracting the wrong kind of attention.
Trap 5: Testing during abnormal periods
Holidays, major news cycles, or platform-wide shifts can distort distribution. If results look inconsistent with your baseline, run a confirmation test before rewriting your playbook.
Scaling Beyond A/B: Multivariate Thinking Without Losing Control
Once you’ve run several clean A/B tests, you can expand to “A/B/C” tests or sequential tests that explore a family of openings. The key is still control: you’re not testing everything at once; you’re testing a series of single-variable changes that build on each other.
A simple sequential testing ladder
- Test 1: First frame (result vs problem)
- Test 2: First line (specific outcome vs curiosity)
- Test 3: On-screen label timing (instant vs delayed)
- Test 4: Audio entry (voice on frame 1 vs 0.3s beat lead-in)
This ladder produces a clear map of what matters most for your audience, and it prevents you from “randomly improving” without learning.
Operationalizing the System: A Lightweight Tracking Sheet You’ll Actually Use
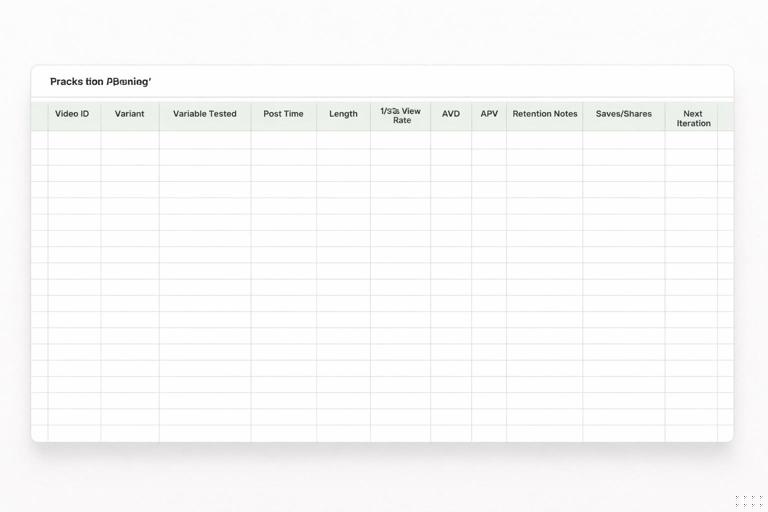
You don’t need complex statistics to benefit from A/B testing, but you do need consistent record-keeping. Use a simple table with repeatable fields so you can spot patterns across weeks.
Columns to track: - Video ID / topic - Variant (A/B) - Opening variable tested - Post date/time - Length (s) - 1s view rate - 3s view rate - AVD - APV - Early retention note (0–5s) - Saves/share rate (if available) - Qualitative notes (top comments, confusion points) - Decision (winner + why) - Next iterationAfter 10–20 tests, you can filter by “variable tested” and see which opening moves consistently improve early retention. That becomes your evidence-based creative instinct.