What “Success” Means During Stabilization vs. Sustained Delivery
In a rescue context, “success” is not a single finish line. It changes as the project moves from unstable to predictable. Stabilization success means the project stops getting worse and starts behaving in a controlled way. Sustained delivery success means the project produces valuable increments reliably, with manageable risk and acceptable quality, without heroics.
To manage this transition, define success criteria and control metrics in two layers:
- Outcome success criteria: what must be true for the business and users (value, compliance, operational readiness). These are the “why.”
- Control metrics: signals that the delivery system is healthy enough to keep producing outcomes (flow, quality, predictability, risk exposure). These are the “how we know we’re in control.”
A common failure mode in turnarounds is using only outcome criteria (e.g., “ship by date X”) without control metrics. That creates pressure to “look green” while hidden instability accumulates (rework, defect debt, unplanned work, burnout). Another failure mode is using only control metrics (e.g., “velocity is up”) without outcome criteria, which can optimize throughput while missing the actual goal.
Two-phase definition of success
- Stabilization phase success: volatility decreases; commitments become credible; quality stops degrading; the team can plan and execute short horizons with high confidence.
- Sustained delivery success: the project meets outcome criteria through a repeatable cadence; metrics remain within control limits; risks are actively managed; stakeholders trust forecasts.
Designing Success Criteria: From Vague Goals to Testable Statements

Success criteria should be specific, testable, and owned. “Improve quality” is not testable; “reduce escaped defects to fewer than 2 per release for three consecutive releases” is testable. “Get back on track” is not testable; “deliver the next two milestones within ±10% of forecast dates and within agreed scope” is testable.
Checklist for good success criteria
- Observable: can be verified with evidence (reports, logs, acceptance results).
- Time-bounded: includes a window (per sprint, per month, per release).
- Threshold-based: defines “good enough” (targets and tolerances).
- Owned: each criterion has an accountable owner and a measurement method.
- Balanced: includes value, predictability, quality, and team sustainability.
Practical examples of outcome success criteria
- Business value: “Enable customers to complete onboarding in under 10 minutes with a success rate of 95%.”
- Regulatory/compliance: “Pass external audit with zero high-severity findings related to data retention.”
- Operational readiness: “Support team can resolve 80% of incidents using runbooks without engineering escalation.”
- Adoption: “At least 60% of target users adopt the new workflow within 30 days of release.”
Practical examples of stabilization success criteria
- Predictability: “For the next 4 iterations, planned vs. completed work stays within ±15%.”
- Quality containment: “No severity-1 production incidents for 30 days; severity-2 incidents reduced by 50%.”
- Flow control: “Work in progress stays at or below agreed WIP limits for 80% of days.”
- Rework reduction: “Reopened items drop below 5% of completed items for 3 consecutive iterations.”
Control Metrics: The Minimum Set That Keeps You Honest
Control metrics are not a dashboard of everything. They are a small set of measures that reveal whether delivery is stable, predictable, and sustainable. In a turnaround, fewer metrics with clear thresholds beat dozens of metrics with no action attached.
- Listen to the audio with the screen off.
- Earn a certificate upon completion.
- Over 5000 courses for you to explore!

Download the app
Metric categories you typically need
- Flow and throughput: are we moving work through the system?
- Predictability: can we forecast reliably?
- Quality: are we building the right thing correctly, and preventing rework?
- Risk and dependencies: are external factors controlled?
- Team sustainability: can we keep delivering without burnout?
Flow metrics (examples and how to use them)
- Cycle time: time from “in progress” to “done.” Use median and 85th percentile, not just average. A falling median with a stable 85th percentile indicates improving flow without hidden long-tail stuck work.
- Throughput: number of items completed per time period. Use it to detect capacity changes and to forecast, but avoid using it as a performance weapon.
- WIP: count of items in progress. WIP is a control lever; set limits and treat breaches as a signal to swarm, de-scope, or unblock.
Example: If throughput rises but cycle time also rises, you may be batching or pushing work downstream, not improving flow. Your action might be to reduce WIP, split work smaller, or remove a bottleneck in testing.
Predictability metrics
- Plan vs. actual completion: compare committed items to completed items per iteration or per week. Track variance and trend.
- Forecast accuracy: for milestones, track the difference between forecast date and actual date. Use a tolerance band (e.g., ±10%).
- Scope stability: measure scope change rate (added/removed items) after commitment. High churn is a leading indicator of missed dates.
Example: If forecast accuracy improves but scope stability worsens, you may be “improving” accuracy by constantly re-forecasting. The control action is to lock a short horizon and route changes through a lightweight change gate.
Quality metrics that prevent rework and incidents
- Escaped defects: defects found after release. Track by severity and by release.
- Defect arrival vs. resolution rate: if arrival exceeds resolution, you are accumulating quality debt.
- Reopen rate: percentage of completed items reopened due to defects or missing acceptance criteria.
- Automated test pass rate / build health: track stability of the pipeline; frequent red builds are a control failure.
Example: A team can “deliver” many items while escaped defects climb. A control rule might be: if escaped defects exceed a threshold, reduce new feature intake and allocate capacity to defect containment until back within limits.
Risk and dependency control metrics
- Dependency readiness: percentage of upcoming work blocked by external dependencies not yet confirmed. Track for the next 2–4 weeks.
- Risk burn-down: number of high risks with active mitigations vs. unmanaged. The key is not the count, but whether each has an owner, next action, and due date.
- Vendor/service SLA adherence: for critical vendors, track missed SLAs, response times, and open critical issues.
Example: If dependency readiness is low for near-term work, your plan is not executable. The control action is to reorder the backlog, secure commitments, or create fallback options.
Team sustainability metrics (use carefully)
- Unplanned work ratio: percentage of time spent on interrupts, incidents, and urgent requests. High ratios indicate instability.
- After-hours work frequency: track as a health signal, not a badge of honor.
- Staffing stability: attrition risk, key role coverage, and onboarding load.
These metrics should be used to trigger support (reduce scope, add help, remove blockers), not to punish. If people fear the metrics, the data will become unreliable.
Step-by-Step: Building a Stabilization Scorecard in 90 Minutes
This is a practical workshop you can run with the project leadership group (delivery lead, product lead, QA lead, operations/support, and a sponsor representative). The output is a one-page scorecard with thresholds and actions.
Step 1: Define the time horizons
- Now (stabilization): next 2–6 weeks.
- Next (sustained delivery): next 2–3 months or next release train.
Different horizons require different tolerances. Stabilization often accepts reduced scope and slower throughput in exchange for control.
Step 2: Pick 3–5 outcome success criteria
Write them as testable statements with thresholds and dates. Assign an owner and evidence source.
Outcome criterion: Customer onboarding success rate ≥ 95% within 30 days of release R2.1. Owner: Product. Evidence: analytics dashboard + support tickets.Step 3: Pick 6–10 control metrics (minimum viable set)
Choose metrics that you can measure weekly without heavy manual work. Ensure each metric has:
- Definition (what counts, start/stop points)
- Target and tolerance band
- Data source
- Owner
Control metric: Cycle time (in-progress to done), median and 85th percentile, weekly. Target: median ≤ 5 days; 85th ≤ 10 days. Source: work tracking tool. Owner: Delivery lead.Step 4: Set “control limits” and trigger actions
For each metric, define what happens when it goes out of bounds. Without triggers, metrics become passive reporting.
- Green: within limits; continue.
- Amber: early warning; investigate within 48 hours; agree corrective action.
- Red: out of control; execute a predefined response (pause intake, swarm, escalate dependency, run quality gate).
If escaped defects (sev1+sev2) > 3 in a release window: Red. Action: freeze new feature merges for 48 hours, run defect triage twice daily, allocate 50% capacity to containment until back to Amber.Step 5: Validate metric integrity (avoid gaming and ambiguity)
Ask: “How could this metric be accidentally misleading?” and “How could it be gamed?” Then adjust definitions.
- Cycle time can be gamed by delaying the “start” state; define start as first commit or first active work log.
- Throughput can be inflated by splitting work too small; pair it with outcome checks and defect rates.
- Plan vs. actual can be gamed by under-committing; pair it with a minimum value delivery expectation.
Step 6: Publish the scorecard and embed it into governance
Make the scorecard the default agenda for weekly steering and delivery reviews. The point is not to “report status,” but to decide actions based on control signals.
Control Metric Definitions That Commonly Cause Confusion
Cycle time vs. lead time
Lead time measures from request to delivery; cycle time measures from start of work to completion. In rescues, cycle time is often the better control metric because it reflects execution efficiency and bottlenecks. Lead time is useful for stakeholder expectations and service levels, but it can be distorted by backlog size and prioritization.
Velocity vs. throughput
Velocity depends on estimation units and team calibration; it is hard to compare across teams or time if estimation changes. Throughput counts completed items; it is simpler but depends on consistent item sizing. If you use velocity, treat it as an internal planning tool, not a success metric. If you use throughput, enforce a “right-sized work item” policy to keep it meaningful.
Percent complete vs. evidence-based progress
Percent complete is frequently subjective and hides integration risk. Prefer evidence-based progress measures such as: number of items accepted, number of tests passed, environments deployed, or end-to-end scenarios validated. If you must use percent complete, tie it to objective exit criteria for each stage.
Practical Patterns: Linking Metrics to Decisions
Metrics matter only if they change behavior. Below are common rescue decisions and the control metrics that should drive them.
Decision: “Can we safely increase scope intake?”
- Cycle time stable or decreasing
- WIP within limits
- Escaped defects within tolerance for at least 2 release cycles
- Unplanned work ratio trending down
If any are red, increasing scope is likely to reintroduce instability. The safer move is to keep intake flat and invest in bottleneck removal.
Decision: “Do we need a quality gate before release?”
- Reopen rate rising
- Build instability (frequent failures)
- Defect arrival rate exceeds resolution rate
- High-severity defects found late in the cycle
Trigger a gate that requires specific evidence (e.g., end-to-end test suite pass, performance baseline, security scan results) before promoting to production.
Decision: “Is the plan executable for the next 2–4 weeks?”
- Dependency readiness high (few unconfirmed blockers)
- Scope churn low after commitment
- Team capacity stable (no major absences, onboarding load manageable)
If dependency readiness is low, the plan is aspirational. Reorder work to what is unblocked, or secure dependency commitments before committing publicly.
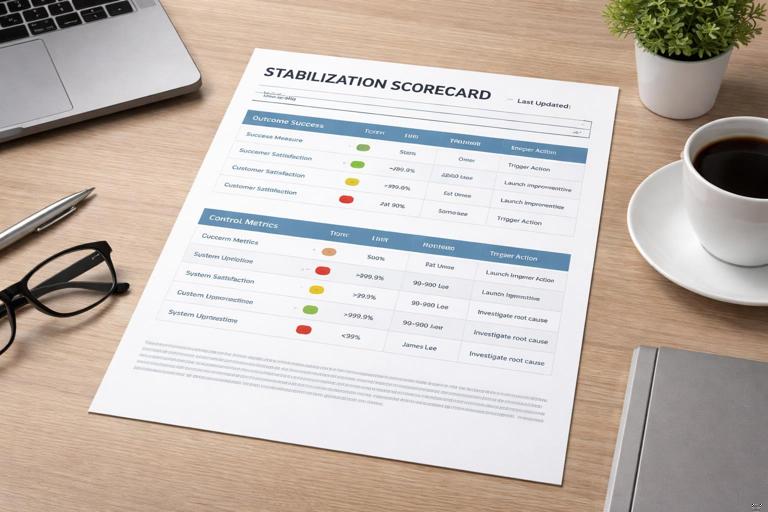
Example: A One-Page Stabilization Scorecard (Template)
Use this as a starting point and tailor thresholds to your context.
OUTCOME SUCCESS (Next 8–12 weeks) — Owner / Evidence / Target / Tolerance / Status- Customer onboarding completion rate — Product / Analytics — ≥95% / ≥92% / Amber
- Audit readiness for data retention — Compliance / Audit checklist — 0 high findings / 0 / Green
- Support escalation rate — Ops / Ticketing — ≤20% / ≤25% / Amber
CONTROL METRICS (Weekly) — Definition / Target / Trigger action- Cycle time (median, 85th) — In progress→Done — ≤5d, ≤10d — If Red: reduce WIP, swarm bottleneck
- WIP limit adherence — Days within WIP limit — ≥80% — If Red: stop starting, finish work
- Plan vs actual — Completed/Committed — 85–115% — If Red: shorten horizon, re-slice work
- Scope churn — Added+Removed after commit — ≤10% — If Red: enforce change gate
- Escaped defects (sev1+sev2) — Post-release — ≤2/release — If Red: feature freeze + containment
- Reopen rate — Reopened/Done — ≤5% — If Red: tighten acceptance criteria, add review
- Build health — % green builds — ≥90% — If Red: stop merges until fixed
- Unplanned work ratio — Interrupt hours/total — ≤20% — If Red: triage intake, add buffer
- Dependency readiness — Blocked items next 2 weeks — ≤10% — If Red: escalate + reorder
Operationalizing Metrics: Cadence, Ownership, and Data Hygiene
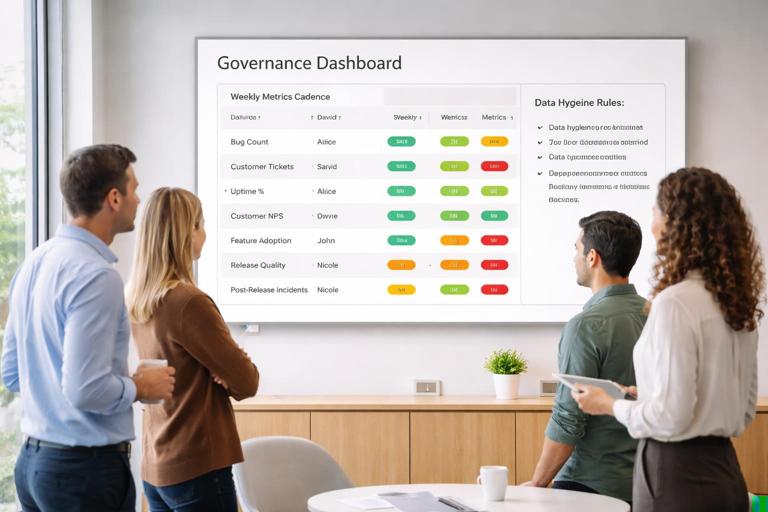
Cadence: daily, weekly, and per-release
- Daily: WIP, blockers aging, build health, incident signals.
- Weekly: cycle time, throughput, plan vs actual, scope churn, unplanned work ratio, dependency readiness.
- Per-release: escaped defects, adoption/usage, performance baselines, support escalations.
Stabilization requires tighter feedback loops. If you only review metrics monthly, you will detect loss of control too late.
Ownership: one metric, one accountable person
Assign an owner for each metric who is responsible for: definition clarity, data collection reliability, and initiating the trigger action when thresholds are breached. Ownership does not mean they personally fix everything; it means they ensure the response happens.
Data hygiene rules that keep metrics trustworthy
- State definitions: define what “in progress,” “done,” and “blocked” mean. “Done” should include acceptance and required quality checks.
- Timestamp integrity: ensure tools capture start/finish dates consistently; avoid manual backdating.
- Item sizing policy: define what a “work item” is (e.g., user story, ticket) and enforce splitting when items exceed a size threshold.
- Single source of truth: avoid multiple competing dashboards; pick one system for work status and one for production/support signals.
Common Anti-Patterns and How to Correct Them
Anti-pattern: Metrics as punishment
If metrics are used to blame individuals or teams, people will hide problems, manipulate states, or stop reporting. Corrective action: make metrics about system behavior, not personal performance; pair every red metric with a leadership-owned support action (remove blocker, reduce scope, add capacity, clarify priorities).
Anti-pattern: Too many metrics, no decisions
Large dashboards create the illusion of control. Corrective action: reduce to the minimum set, add thresholds, and define trigger actions. If a metric does not change a decision, remove it.
Anti-pattern: Chasing green by re-baselining constantly
Frequent re-forecasting can hide instability. Corrective action: lock a short commitment window, track scope churn, and require explicit approval for changes after commitment.
Anti-pattern: Optimizing local throughput while global outcomes suffer
A team can increase throughput by pushing work downstream, creating integration or operational pain. Corrective action: include end-to-end quality and operational metrics (escaped defects, support escalations, deployment success) alongside flow metrics.
Step-by-Step: Using Control Metrics to Run a Weekly Stabilization Review
This meeting is a control loop, not a status meeting. Keep it to 45–60 minutes, and make decisions.
Step 1: Review outcome criteria first (5–10 minutes)
- Are we still aligned on the outcomes?
- Any evidence that outcomes are at risk (adoption, compliance, operational readiness)?
Step 2: Review control metrics with thresholds (15–20 minutes)
- Which metrics are Amber/Red?
- Are they isolated or correlated (e.g., WIP up, cycle time up, defects up)?
Step 3: Decide corrective actions (15–20 minutes)
For each Red metric, choose one action and assign an owner and due date. Examples:
- Reduce WIP by pausing new starts and swarming top blockers.
- Introduce a temporary quality gate for high-risk components.
- Reorder near-term work to remove dependency risk.
- Allocate a fixed capacity buffer for unplanned work.
Step 4: Confirm next-week hypotheses (5 minutes)
Write down what you expect to change if the actions work (e.g., “Cycle time 85th percentile should drop from 18 days to under 12 days”). This turns the review into an experiment loop rather than opinion debates.
Calibrating Targets: Setting Thresholds That Drive the Right Behavior
Targets that are too aggressive create gaming and burnout; targets that are too loose fail to create control. Use calibration rules:
- Start with baseline: use the last 2–4 weeks of data as the initial baseline.
- Improve gradually: aim for incremental improvement (e.g., 10–20% reduction in cycle time over a month) unless there is a clear bottleneck you can remove quickly.
- Use tolerance bands: avoid single-point targets; define acceptable ranges.
- Separate leading and lagging indicators: cycle time and WIP are leading; escaped defects are lagging. Use both.
Example calibration: If your current median cycle time is 9 days and 85th percentile is 25 days, setting a target of 3 days next week is unrealistic. A better stabilization target might be median ≤ 8 days and 85th ≤ 20 days for the next two weeks, with a specific bottleneck-removal action.