What “Rapid Diagnostic Triage” Means in a Rescue Context
Rapid diagnostic triage is a time-boxed, evidence-driven assessment that determines where a troubled project is bleeding the most and what must be stabilized first. The goal is not to produce a perfect plan; it is to quickly establish a reliable picture of reality across six dimensions—scope, schedule, cost, quality, risk, and team health—so you can choose the smallest set of actions that stops further damage and creates room for recovery.
Triage differs from a normal status review in three ways. First, it is ruthless about time: you work in short cycles (hours to days), not weeks. Second, it is comparative: you assess each dimension using the same scale so you can prioritize. Third, it is decision-oriented: every finding must lead to a concrete next step (clarify, stop, renegotiate, re-sequence, or resource).
A useful mental model is “stabilize, then optimize.” Triage focuses on stabilization: remove ambiguity, stop uncontrolled change, surface hidden work, and reduce rework. Optimization (process improvements, tooling, long-term refactoring) can wait until the project is no longer in free fall.
The Triage Framework: Six Dimensions, One Scorecard
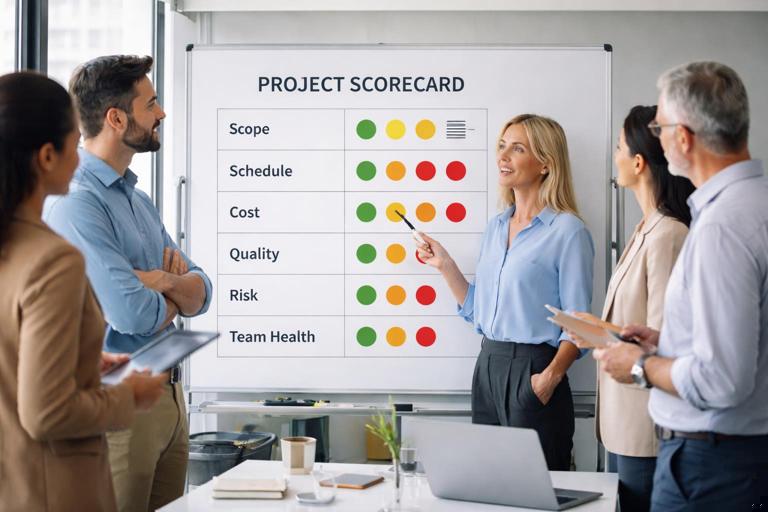
To avoid getting lost in details, use a single scorecard that covers all six dimensions. Each dimension is assessed with a small set of indicators, a confidence level, and an immediate action recommendation.
Suggested scoring scale
- Green (1): Under control; only routine management needed.
- Yellow (2): Some instability; needs targeted intervention.
- Orange (3): Material threat to outcomes; needs immediate containment.
- Red (4): Actively failing; requires decisive change (re-baseline, de-scope, pause, or leadership escalation).
Add a confidence tag to each score: High/Medium/Low. Low confidence means you lack trustworthy data and should prioritize data validation before making irreversible decisions.
- Listen to the audio with the screen off.
- Earn a certificate upon completion.
- Over 5000 courses for you to explore!

Download the app
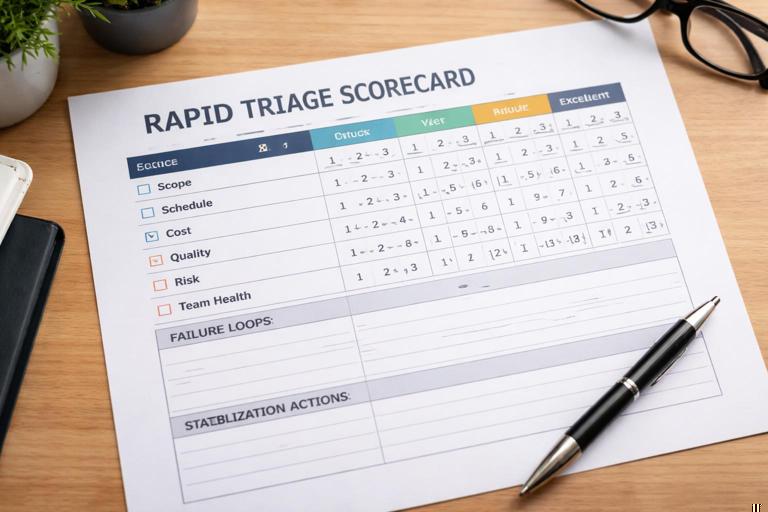
Minimum artifacts to produce during triage
- One-page triage scorecard (six dimensions, scores, confidence, key evidence, immediate actions).
- Top 10 constraints list (what is blocking progress right now).
- 48-hour stabilization plan (actions, owners, expected outcomes).
- Decision log (what was decided, by whom, and why).
Step-by-Step: Running a Rapid Triage in 48 Hours
This sequence assumes you have authority to convene stakeholders and access to project data. If you do not, your first action is to secure sponsorship for the triage time-box and access.
Step 1: Set the time-box and rules of engagement (30–60 minutes)
Announce a short triage window (e.g., two business days) and define what will happen during it. The key is to prevent the triage from becoming another endless “analysis” effort.
- Define the objective: establish reality, identify the biggest drivers of failure, and propose immediate stabilization actions.
- Freeze non-essential change: temporarily pause new scope intake and major design changes unless they address a critical defect or safety/compliance issue.
- Agree on data sources: which tools and documents are considered authoritative (issue tracker, repo, financial system, contract, etc.).
- Set meeting cadence: short interviews plus one daily synthesis checkpoint.
Step 2: Collect “fast evidence” (3–6 hours)
Gather the smallest set of data that reveals the truth. Avoid polishing; focus on verifiable signals.
- Scope evidence: current requirements list, backlog, change requests, acceptance criteria, contract statements of work.
- Schedule evidence: milestone plan, sprint history, burndown/burnup, critical path items, dependency map.
- Cost evidence: burn rate, forecast vs. actuals, vendor invoices, remaining budget, staffing plan.
- Quality evidence: defect trends, escaped defects, test coverage indicators, build stability, rework rate.
- Risk evidence: risk register (if any), open decisions, top unknowns, external dependencies.
- Team health evidence: attrition, on-call load, overtime, conflict points, role clarity.
If you cannot find an artifact, treat the absence as evidence: it often indicates unmanaged work or hidden assumptions.
Step 3: Conduct targeted interviews (6–10 interviews, 30 minutes each)
Interview a cross-section: sponsor, product owner/customer, delivery lead, architect/tech lead, QA lead, finance/procurement, and two to three frontline contributors. Use the same questions to compare perspectives.
- What is the single most important outcome this project must deliver?
- What do you believe is the biggest obstacle right now?
- What work is happening that is not visible in the plan?
- Where are we redoing work, and why?
- What decision is being avoided?
- If we had to ship something in 30 days, what would it be?
Listen for contradictions. Contradictions are not “politics” to ignore; they are diagnostic clues that scope, schedule, or quality expectations are misaligned.
Step 4: Score each dimension using explicit indicators (2–3 hours)
Use the indicators below to assign a score and confidence level. The point is consistency: you want a comparable view across dimensions.
Step 5: Identify the “primary failure mode” (60–90 minutes)
Most troubled projects have one or two dominant failure modes that cascade into others. For example, uncontrolled scope drives schedule slips, which drives overtime, which drives quality issues, which drives more schedule slips. Your job is to identify the loop and break it.
Ask: if we fixed only one dimension first, which fix would reduce pressure on the others? That is usually your first stabilization target.
Step 6: Produce a 48-hour stabilization plan (60–90 minutes)
Choose 3–7 actions that can be executed immediately. Each action must have an owner, a short deadline, and a measurable outcome.
- Example outcomes: “Backlog reduced to 40 items with acceptance criteria,” “Critical path dependencies confirmed with owners,” “Defect triage SLA established,” “Budget forecast updated with three scenarios.”
Dimension 1: Scope Triage (What Are We Actually Building?)

Scope triage determines whether the project has a stable, shared definition of “done” and whether the current work aligns with that definition. In rescue situations, scope is often both too large and too vague.
Key indicators for scope
- Definition of done exists and is shared: acceptance criteria are explicit and testable.
- Backlog/requirements are prioritized: there is a clear top slice that delivers value.
- Change control is functioning: changes are evaluated for impact and approved by the right authority.
- Work in progress is bounded: the team is not starting everything at once.
Common scope failure patterns
- “Everything is P0”: no prioritization, leading to thrash and partial delivery.
- Proxy customer problem: decisions are made without real user validation, causing rework.
- Hidden scope: non-functional requirements (security, performance, compliance) appear late.
Practical scope triage steps
- Create a scope snapshot: list the top 20 deliverables/features and mark each as Committed / Proposed / Unclear.
- Force ranking: ask the sponsor/customer to rank the top 10 outcomes; ties are not allowed.
- Define a Minimum Shippable Slice: a coherent subset that can be accepted end-to-end.
- Install a temporary change gate: all new requests go through a single weekly review with impact notes.
Example: A product team has 120 backlog items and constant stakeholder requests. In triage, you identify that only 15 items are needed to support the next regulatory deadline. You mark those 15 as “Committed,” freeze the rest as “Proposed,” and require any new request to name which committed item it displaces. This immediately reduces multitasking and clarifies trade-offs.
Dimension 2: Schedule Triage (Can We Predict Delivery?)
Schedule triage is about predictability, not optimism. A schedule can be late and still be manageable if it is realistic and actively controlled. A schedule is dangerous when it is disconnected from actual throughput and dependencies.
Key indicators for schedule
- Milestones are tied to deliverables: not just dates, but measurable outputs.
- Critical path is known: the few items that determine the finish date are identified.
- Dependencies are owned: every dependency has a named owner and due date.
- Throughput is measured: velocity, cycle time, or completed work rate is tracked and stable enough to forecast.
Common schedule failure patterns
- “90% done” syndrome: many tasks nearly finished, few actually completed.
- Dependency fog: external teams/vendors block progress without clear commitments.
- Planning based on effort, not flow: tasks estimated but bottlenecks ignored (testing, reviews, environments).
Practical schedule triage steps
- Build a 1-page milestone map: next 3–5 milestones with entry/exit criteria.
- Identify the constraint: where work queues up (QA, code review, environment provisioning, approvals).
- Re-forecast using actuals: use the last 4–8 weeks of throughput to project completion ranges.
- Create a dependency handshake: a short written agreement with other teams on dates and deliverables.
Example: A program claims it will finish in eight weeks, but the last six sprints show an average of 10 story points completed while 25 are planned. Triage re-forecasts using actual throughput and reveals a 14–18 week range. The rescue action is to either reduce scope to fit eight weeks or renegotiate the date with evidence.
Dimension 3: Cost Triage (Are We Burning Money Without Progress?)
Cost triage establishes whether spending aligns with delivered value and whether the project can finish within financial constraints. In rescues, cost problems often hide behind schedule problems: delays extend staffing and vendor costs, and rework inflates burn.
Key indicators for cost
- Burn rate is known: weekly/monthly run rate for internal and external costs.
- Forecast is updated: estimate-to-complete reflects current reality, not the original plan.
- Cost drivers are identified: top 3–5 categories (contractors, cloud spend, licensing, overtime).
- Financial guardrails exist: approval thresholds and spend monitoring are active.
Common cost failure patterns
- “Sunk cost chasing”: continuing because of past spend rather than future value.
- Vendor drift: statements of work expand informally without change orders.
- Invisible internal cost: key staff are pulled in, but their time is not accounted for.
Practical cost triage steps
- Create a simple cost model: people cost per week + vendor cost per week + variable infrastructure cost.
- Compute cost per delivered unit: e.g., cost per accepted feature, cost per released increment.
- Run three scenarios: (A) keep scope/date, (B) reduce scope to meet date, (C) extend date to meet scope.
- Stop non-essential spend: pause low-value tooling, unused environments, or non-critical vendor work until scope is clarified.
Example: A project spends $250k/month with two vendors. Triage finds one vendor is building features not in the committed scope. You pause that work, renegotiate deliverables, and redirect budget to stabilize testing automation that is blocking releases.
Dimension 4: Quality Triage (Is the Product Fit to Release?)
Quality triage determines whether the project is accumulating defects and rework faster than it can resolve them. In troubled projects, quality issues are often treated as “later,” but they become schedule and cost multipliers.
Key indicators for quality
- Defect trend: new defects vs. resolved defects over time.
- Escaped defects: issues found late (UAT/production) indicating weak earlier controls.
- Build/release stability: frequency of broken builds, rollback events, hotfixes.
- Test readiness: environments, test data, and test cases are available and maintained.
Common quality failure patterns
- Testing as a phase: QA is overloaded at the end, creating a bottleneck.
- Unclear acceptance criteria: features are “done” but not verifiable.
- High rework loops: defects and requirement misunderstandings cause repeated re-implementation.
Practical quality triage steps
- Establish a defect triage cadence: daily or twice weekly, with severity definitions and owners.
- Define release quality gates: e.g., no open critical defects, smoke tests pass, performance baseline met.
- Target the top defect sources: identify modules/components with the highest defect density and focus fixes there.
- Reduce WIP: fewer parallel features means more time to finish and verify each one.
Example: A team reports “QA is slowing us down.” Triage shows QA is receiving large batches with incomplete acceptance criteria and unstable builds. The stabilization action is to require acceptance criteria before development starts and to implement a “build must be green” rule before new work is merged.
Dimension 5: Risk Triage (What Could Still Sink Us?)
Risk triage identifies the uncertainties and external factors that could derail recovery even if scope, schedule, cost, and quality are addressed. In rescues, the most dangerous risks are often unspoken: legal constraints, data migration unknowns, integration dependencies, or stakeholder alignment gaps.
Key indicators for risk
- Top risks are explicit: documented with probability, impact, and owner.
- Mitigations are real work: tasks exist on the plan/backlog, not just words.
- Decision latency is tracked: how long critical decisions remain open.
- External dependencies are monitored: vendor deliveries, approvals, infrastructure readiness.
Common risk failure patterns
- Risk register theater: risks listed but never acted upon.
- Unknown-unknowns ignored: assumptions treated as facts (data quality, performance, security).
- Single points of failure: one person or one system holds critical knowledge/access.
Practical risk triage steps
- Create a “Top 10 risks” wall: visible list with owners and next mitigation step.
- Convert assumptions into tests: run spikes/prototypes to validate integration, performance, migration, or compliance.
- Time-box decisions: define decision deadlines and escalation paths.
- Build contingency options: alternate vendors, phased rollout, feature flags, manual fallback processes.
Example: A system depends on an external API that is not yet stable. Instead of hoping, triage creates a mitigation: build a stub service and a fallback mode, and schedule an integration test milestone with the external team by a fixed date.
Dimension 6: Team Health Triage (Can the Team Sustain Recovery?)

Team health triage assesses whether the people system can execute a recovery plan. A project can have a brilliant plan and still fail if the team is exhausted, roles are unclear, or trust is broken. Team health is not “soft”; it directly affects throughput, quality, and decision speed.
Key indicators for team health
- Role clarity: who decides, who builds, who tests, who approves.
- Workload sustainability: overtime levels, on-call burden, context switching.
- Psychological safety: ability to surface problems without blame.
- Collaboration health: conflict patterns, handoff friction, stakeholder behavior.
Common team health failure patterns
- Hero culture: a few individuals carry the project, creating fragility and burnout.
- Blame loops: dev vs. QA vs. product conflicts, reducing transparency.
- Leadership vacuum: no one can make trade-offs, so everything stalls.
Practical team health triage steps
- Map responsibilities: a simple RACI for the next 30 days of critical work.
- Reduce context switching: dedicate people to the critical path; stop side projects temporarily.
- Install a no-blame incident review: focus on system fixes for defects/outages.
- Set sustainable operating rules: limit overtime, protect focus time, clarify escalation routes.
Example: A team is working nights to hit dates, but defects keep rising. Triage shows burnout and constant priority changes. The stabilization action is to freeze scope changes for two weeks, limit WIP, and rotate on-call duties while leadership commits to a single prioritized backlog.
Integrating the Six Dimensions: Finding the Leverage Point
The power of triage comes from connecting dimensions rather than treating them as separate checklists. Use a simple cause-and-effect mapping to identify reinforcing loops.
Common reinforcing loops in troubled projects
- Scope volatility → schedule slips → overtime → quality decline → more rework → further schedule slips
- Unclear acceptance criteria → rework → cost overrun → pressure to cut testing → escaped defects → reputational risk
- Dependency delays → idle time → parallel work starts → integration failures → quality issues → schedule slips
How to choose the first stabilization target
- If scope is unstable: prioritize scope control and a minimum shippable slice.
- If schedule is unpredictable: prioritize dependency ownership and re-forecasting based on actual throughput.
- If quality is collapsing: prioritize quality gates and defect triage to stop rework growth.
- If team health is failing: prioritize workload sustainability and decision clarity; otherwise execution will not improve.
In practice, you often act on two dimensions at once: one “work system” fix (scope/schedule/quality) and one “people system” fix (team health/decision rights). This combination increases the chance that the technical plan is actually executed.
Worked Example: 48-Hour Triage Output (Template)
Below is a compact template you can use to synthesize findings. Keep it short enough to be read in five minutes.
Rapid Triage Scorecard (Time-box: 48 hours)  Date: ______  Owner: ______

SCOPE: Score __ (Confidence: __)
Evidence: ______________________________________________
Primary issue: __________________________________________
Immediate action (48h): _________________________________

SCHEDULE: Score __ (Confidence: __)
Evidence: ______________________________________________
Primary issue: __________________________________________
Immediate action (48h): _________________________________

COST: Score __ (Confidence: __)
Evidence: ______________________________________________
Primary issue: __________________________________________
Immediate action (48h): _________________________________

QUALITY: Score __ (Confidence: __)
Evidence: ______________________________________________
Primary issue: __________________________________________
Immediate action (48h): _________________________________

RISK: Score __ (Confidence: __)
Evidence: ______________________________________________
Primary issue: __________________________________________
Immediate action (48h): _________________________________

TEAM HEALTH: Score __ (Confidence: __)
Evidence: ______________________________________________
Primary issue: __________________________________________
Immediate action (48h): _________________________________

Top 3 cross-dimension failure loops:
1) __________________________________________
2) __________________________________________
3) __________________________________________

48-hour stabilization actions (3–7):
- Action: __________ Owner: ______ Due: ____ Outcome: ____
- Action: __________ Owner: ______ Due: ____ Outcome: ____
- Action: __________ Owner: ______ Due: ____ Outcome: ____
Use this scorecard to drive a short alignment meeting with decision-makers. The meeting should focus on trade-offs and commitments: what will be stopped, what will be prioritized, and what will be renegotiated.
Practical Interview-to-Action Mapping (So Findings Don’t Stall)
Rapid triage fails when insights do not translate into immediate operational changes. Use the mapping below to convert common interview statements into actions.
If you hear: “We’re waiting on approvals”
- Likely dimension: Schedule/Risk/Team health
- Action: create a decision log with deadlines; assign a single approver; define escalation after 48 hours.
If you hear: “Requirements keep changing”
- Likely dimension: Scope/Schedule/Team health
- Action: implement a change gate; force trade-offs (new item replaces an existing committed item); clarify acceptance criteria.
If you hear: “QA is overwhelmed”
- Likely dimension: Quality/Schedule
- Action: reduce WIP; define quality gates; shift testing left by requiring acceptance criteria and stable builds.
If you hear: “We’re out of budget”
- Likely dimension: Cost/Scope
- Action: run three scenarios; pause low-value work; renegotiate scope/date with evidence.
If you hear: “People are burning out”
- Likely dimension: Team health/Quality
- Action: cap overtime; reduce context switching; clarify priorities; remove non-critical commitments.